What’s in Charlotte County’s water?
Know your supplier. Understand your water. Find your system.
Charlotte County has more than one water system. Explore disinfectants, disinfection byproducts, metals and historical PFAS results from Charlotte County Utilities and Englewood Water District. Match the supplier on your bill before using any result for your home. Source
Email report
Email this water report
Keep a copy for yourself, or share it with someone else.
Email sharing is coming soon. This preview does not send or save email addresses.
Cities & communities in Charlotte County
Choose a community for local context and the relevant utility reports.
Choose the report for your utility
Start with the provider and system on your bill. County utility customers may use the Peace River or Burnt Store system. Englewood Water District serves parts of Charlotte and Sarasota counties. City of Punta Gorda and other utility customers need their own supplier’s report.
Match the utility and system on your water bill. A ZIP code or mailing address does not establish service boundaries.
What the reports measured
Browse the selected results by utility. These are substances and indicators—not a count of hazards in your home. Open the linked reports for the complete utility records.
ppm = mg/L; ppb = µg/L; ppt = ng/L. ND means below detection, not zero. MCL and MRDL are regulatory benchmarks reported in the source; action levels trigger system action. Annual averages, individual samples and household-tap percentiles are different measures. Compare like with like.
Sample years stay attached to each result. These historical reports do not replace current utility notices or a test of your tap.
34 report entries
No entries match. Try another search or source.
01Charlotte County Utilities · distribution systemReported results, sample dates and source links5
| Substance / indicator | Reported result | Benchmark in source | Sample year / source |
|---|---|---|---|
| Chloramines | 2.3 ppmReported compliance valueIndividual range: 0.5–5.2 ppm | MRDL 4 ppm | 2025 Source |
| Haloacetic acids (HAA5)Individual samples differ from the compliance value. The source’s explanatory paragraph contains inconsistent figures; these are its table values. | 44 ppbReported compliance valueIndividual range: 9.3–107 ppb | MCL 60 ppb | 2025 Source |
| Total trihalomethanes (TTHM)Individual samples differ from the compliance value. The source’s explanatory paragraph contains inconsistent figures; these are its table values. | 76 ppbReported compliance valueIndividual range: 31.3–164 ppb | MCL 80 ppb | 2025 Source |
| Lead · household tap samplingFour sampled sites exceeded the action level; the system’s 90th-percentile result did not. | 9.6 ppb90th percentile | Action level 15 ppb in report | June 2023 Source |
| Copper · household tap samplingNo sampled sites exceeded the action level. | 0.22 ppm90th percentile | Action level 1.3 ppm | June 2023 Source |
02Peace River Authority · purchased supplyReported results, sample dates and source links6
| Substance / indicator | Reported result | Benchmark in source | Sample year / source |
|---|---|---|---|
| Alpha emittersWholesale supply result, not a sample from every Charlotte County home. | 2.4 pCi/LReported levelIndividual range: 0.8–2.4 pCi/L | MCL 15 pCi/L | 2025 Source |
| Combined radium | 1.9 pCi/LReported levelIndividual range: 0.6–2.2 pCi/L | MCL 5 pCi/L | 2025 Source |
| Fluoride | 0.273 ppmReported level | MCL 4 ppm | January 2025 Source |
| Nitrate as nitrogen | 0.329 ppmReported level | MCL 10 ppm | January 2025 Source |
| Barium | 0.009 ppmReported level | MCL 2 ppm | January 2025 Source |
| Sodium | 46.5 ppmReported level | 160 ppm in source table | January 2025 Source |
03Charlotte County Utilities · historical PFAS monitoringReported results, sample dates and source links6
| Substance / indicator | Reported result | Benchmark in source | Sample year / source |
|---|---|---|---|
| PFBAHistorical monitoring; not a current tap result. | 0.0075 ppbReported averageIndividual range: 0.0054–0.0096 ppb | No benchmark in this source table | 2023 Source |
| PFBS | 0.0055 ppbReported averageIndividual range: 0.0046–0.0067 ppb | No benchmark in this source table | 2023 Source |
| PFPeA | 0.0046 ppbReported averageIndividual range: 0.0040–0.0054 ppb | No benchmark in this source table | 2023 Source |
| PFHxAMRL means minimum reporting level; below MRL does not mean zero. | 0.0039 ppbReported averageIndividual range: Below MRL–0.0039 ppb | No benchmark in this source table | 2023 Source |
| PFOAThis historical table is not a current regulatory-compliance determination. | 0.0052 ppbReported averageIndividual range: Below MRL–0.0052 ppb | No benchmark in this source table | 2023 Source |
| PFOSThis historical table is not a current regulatory-compliance determination. | 0.0043 ppbReported averageIndividual range: Below MRL–0.0043 ppb | No benchmark in this source table | 2023 Source |
04Charlotte County Utilities · Burnt Store systemReported results, sample dates and source links9
| Substance / indicator | Reported result | Benchmark in source | Sample year / source |
|---|---|---|---|
| Chlorine | 1.6 ppmReported compliance valueIndividual range: 0.8–2.2 ppm | MRDL 4 ppm | 2025 Source |
| Haloacetic acids (HAA5) | 6 ppbReported compliance valueIndividual range: 1.9–6.9 ppb | MCL 60 ppb | 2025 Source |
| Total trihalomethanes (TTHM) | 18 ppbReported compliance valueIndividual range: 12–22 ppb | MCL 80 ppb | 2025 Source |
| Lead · household tap samplingNo sampled sites exceeded the action level. | 3.0 ppb90th percentile | Action level 15 ppb in report | June 2023 Source |
| Copper · household tap samplingNo sampled sites exceeded the action level. | 0.030 ppm90th percentile | Action level 1.3 ppm | June 2023 Source |
| Alpha emittersThe 2025 report carries forward this older sample. | 7.18 pCi/LReported level | MCL 15 pCi/L | June 2020 Source |
| Combined radium | 3.2 pCi/LReported level | MCL 5 pCi/L | June 2023 Source |
| Sodium | 71 ppmReported level | 160 ppm in source table | June 2023 Source |
| Barium | 0.0064 ppmReported level | MCL 2 ppm | June 2023 Source |
05Englewood Water DistrictReported results, sample dates and source links8
| Substance / indicator | Reported result | Benchmark in source | Sample year / source |
|---|---|---|---|
| Chlorine and chloramines | 2.6 ppmReported compliance valueIndividual range: 0.6–5.4 ppm | MRDL 4 ppm | 2025 Source |
| Haloacetic acids (HAA5) | 27.45 ppbReported levelIndividual range: 26.4–28.5 ppb | MCL 60 ppb | August 2025 Source |
| Total trihalomethanes (TTHM) | 22.3 ppbReported levelIndividual range: 22.1–22.5 ppb | MCL 80 ppb | August 2025 Source |
| Lead · household tap samplingOne sampled site exceeded the action level; the system’s 90th-percentile result did not. | 6.08 ppb90th percentile | Action level 15 ppb in report | July–August 2023 Source |
| Copper · household tap samplingNo sampled sites exceeded the action level. | 0.184 ppm90th percentile | Action level 1.3 ppm | July–August 2023 Source |
| Combined radium 226 + 228I: between the laboratory detection limit and practical quantitation limit. | 1.1 pCi/L (I)Reported level with laboratory qualifier | MCL 5 pCi/L | April 2021 Source |
| Nitrate as nitrogen | 0.10 ppmReported level | MCL 10 ppm | August 2025 Source |
| Sodium | 43.3 ppmReported level | 160 ppm in source table | December 2025 Source |
A closer look at your local water
These results describe Charlotte County Utilities (FL5084100), not every home or water system in Charlotte County. Match this system to your water bill before using the results.
Source record: CHARLOTTE COUNTY UTILITIES · Selected test records: 2014-07-15 – 2023-12-01
Results come from different testing periods. A detection is not, by itself, a finding that water is unsafe. “Not detected” means below the test’s reporting level; it does not mean zero. Missing results mean we have not verified that data here.
PFAS monitoring6 of 29 tested PFAS compounds detected
The table shows each compound’s highest reported result and latest listed test date. Those may come from different samples. Results are in parts per trillion (ppt).
| Substance | Highest reported result | Latest listed test | Detected samples |
|---|---|---|---|
| PFOA | 5.2 ppt | 1 | |
| PFOS | 4.3 ppt | 1 | |
| PFBA | 9.6 ppt | 3 | |
| PFBS | 6.7 ppt | 3 | |
| PFPeA | 5.4 ppt | 3 | |
| PFHxA | 3.9 ppt | 1 |
Lithium monitoringNot detected
MyTapWater reports lithium was tested and not detected. Selected lithium sample dates: 2023-02-21 – 2023-11-10
More tested substances12 selected entries
Selected historical tests, with their original dates. “Detected” means at least one positive result in the listed period. “Below reporting level” means all retrieved samples for that entry were below the reporting level. These older tests do not describe today’s water at your tap.
| Substance | Reported result | Sampling period |
|---|---|---|
| chromium | Detected | – |
| chlorate | Detected | – |
| chromium-6 | Detected | – |
| molybdenum | Detected | – |
| strontium | Detected | – |
| vanadium | Detected | – |
| cobalt | Below reporting level | – |
| 17-alpha-ethynylestradiol | Below reporting level | – |
| 17-beta-estradiol | Below reporting level | – |
| 4-androstene-3,17-dione | Below reporting level | – |
| bromomethane | Below reporting level | – |
| chloromethane | Below reporting level | – |
This is a selection of results from MyTapWater, which compiles public water-system records. Open the source for the complete tables, methods and reporting limits. Check your utility’s latest report and current notices for updates. Source
A list of tested substances is not a list of what a filter removes. Choose a system using its verified contaminant-reduction specifications and your water source. A softener addresses hardness and remains optional.
Do you need a water softener?
No. Softening is optional and is a separate decision from filtration. Use a home hardness test and your preferences about scale and water feel; your plumber confirms equipment size and settings.
A softener is optional. The county utility FAQ describes its water as moderately hard without a dated, system-specific measurement. Englewood reports 78 mg/L leaving its lime-softening plant, before blending with reverse-osmosis water. A test of untreated incoming water is the best next step for confirming your home’s hardness. Source
Hardness describes dissolved minerals, not an overall water safety score. A filter and a softener do different jobs. Source
Use my water and home detailsTest at home
No verified finished-water range is shown for this system. A home test provides a starting point.
Softening is an optional choice for scale and water feel.
A filter, a softener, or both?
Choose the job you need done. Size comes next, based on water use and peak flow.
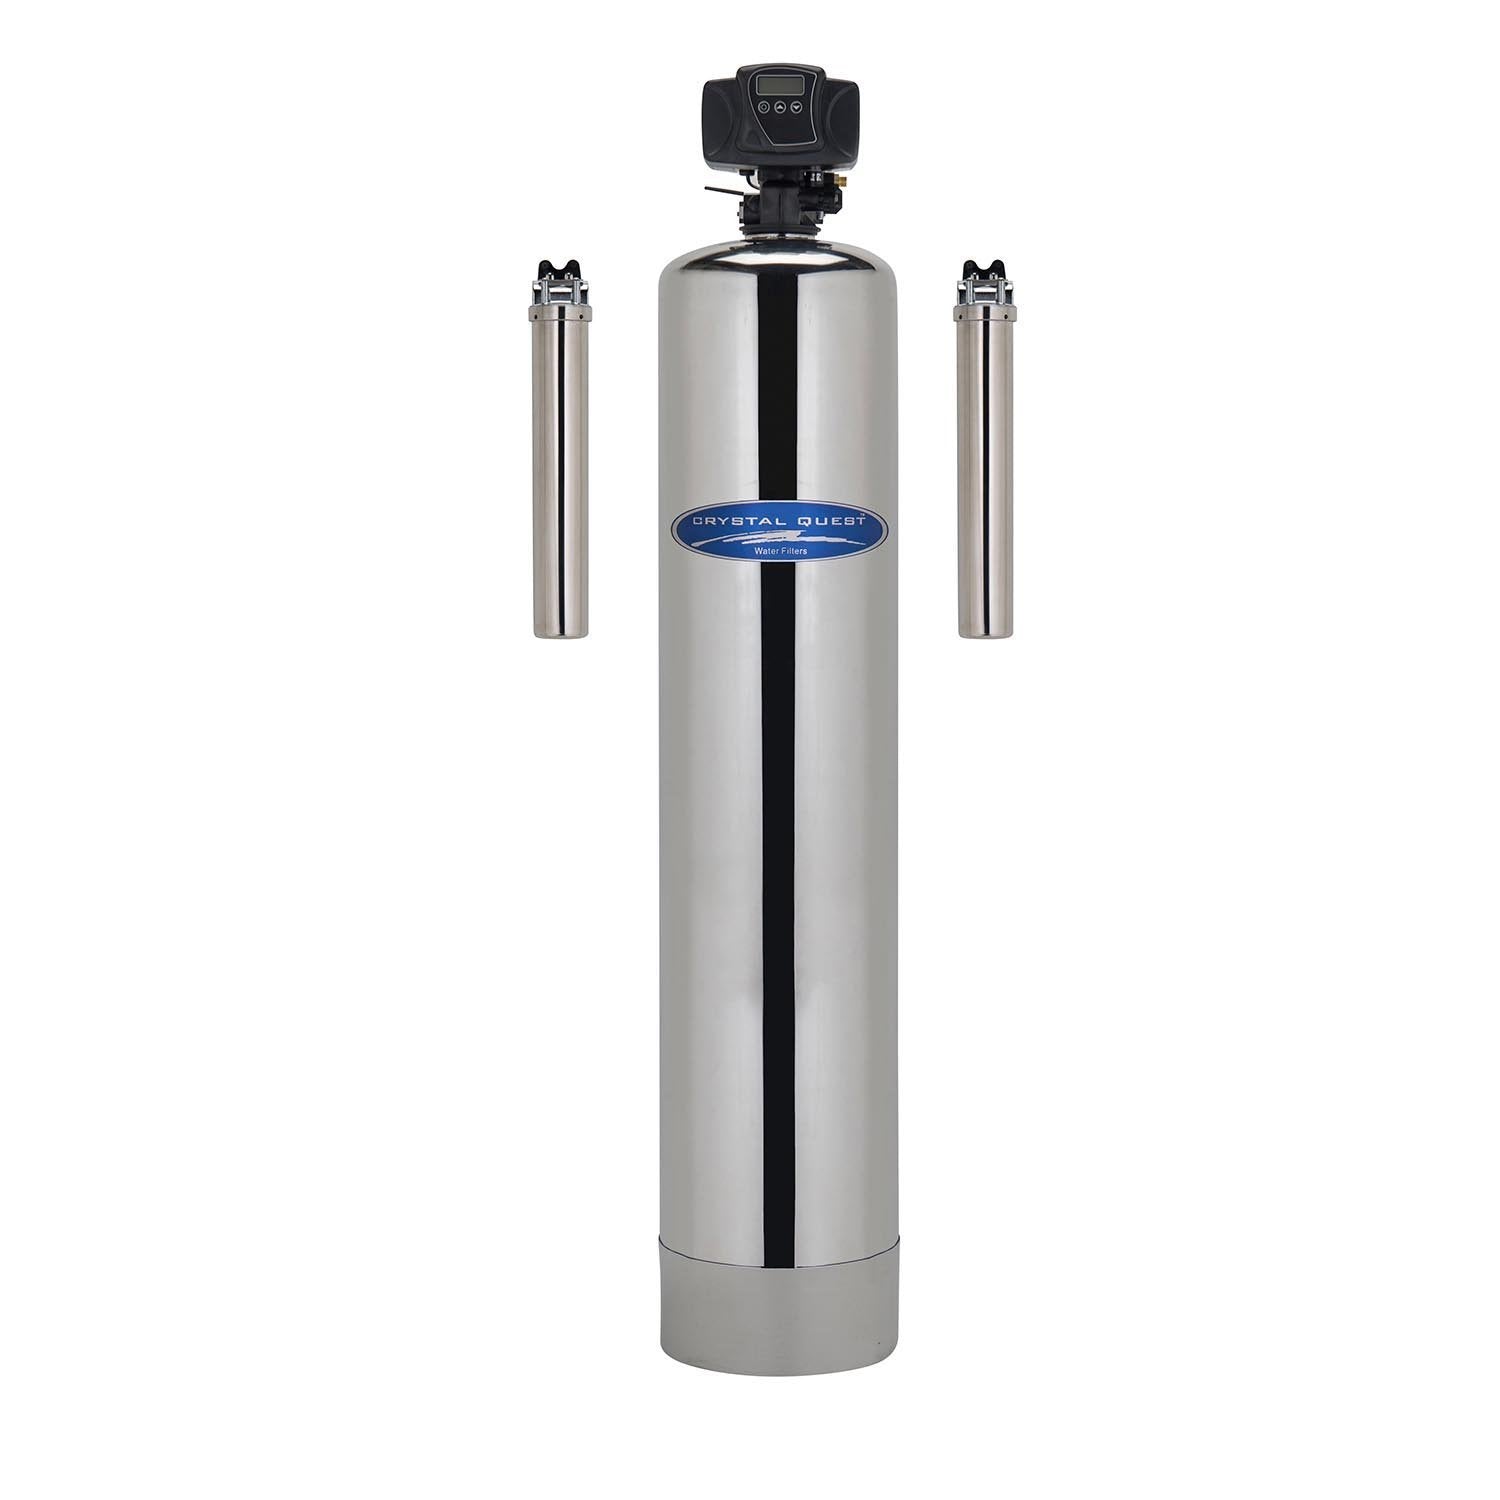
Stainless steel whole-home filter
For whole-home filtration goals. Match the exact system’s performance claims to the substances you want to address.
A filter alone does not replace a hardness-removing softener.
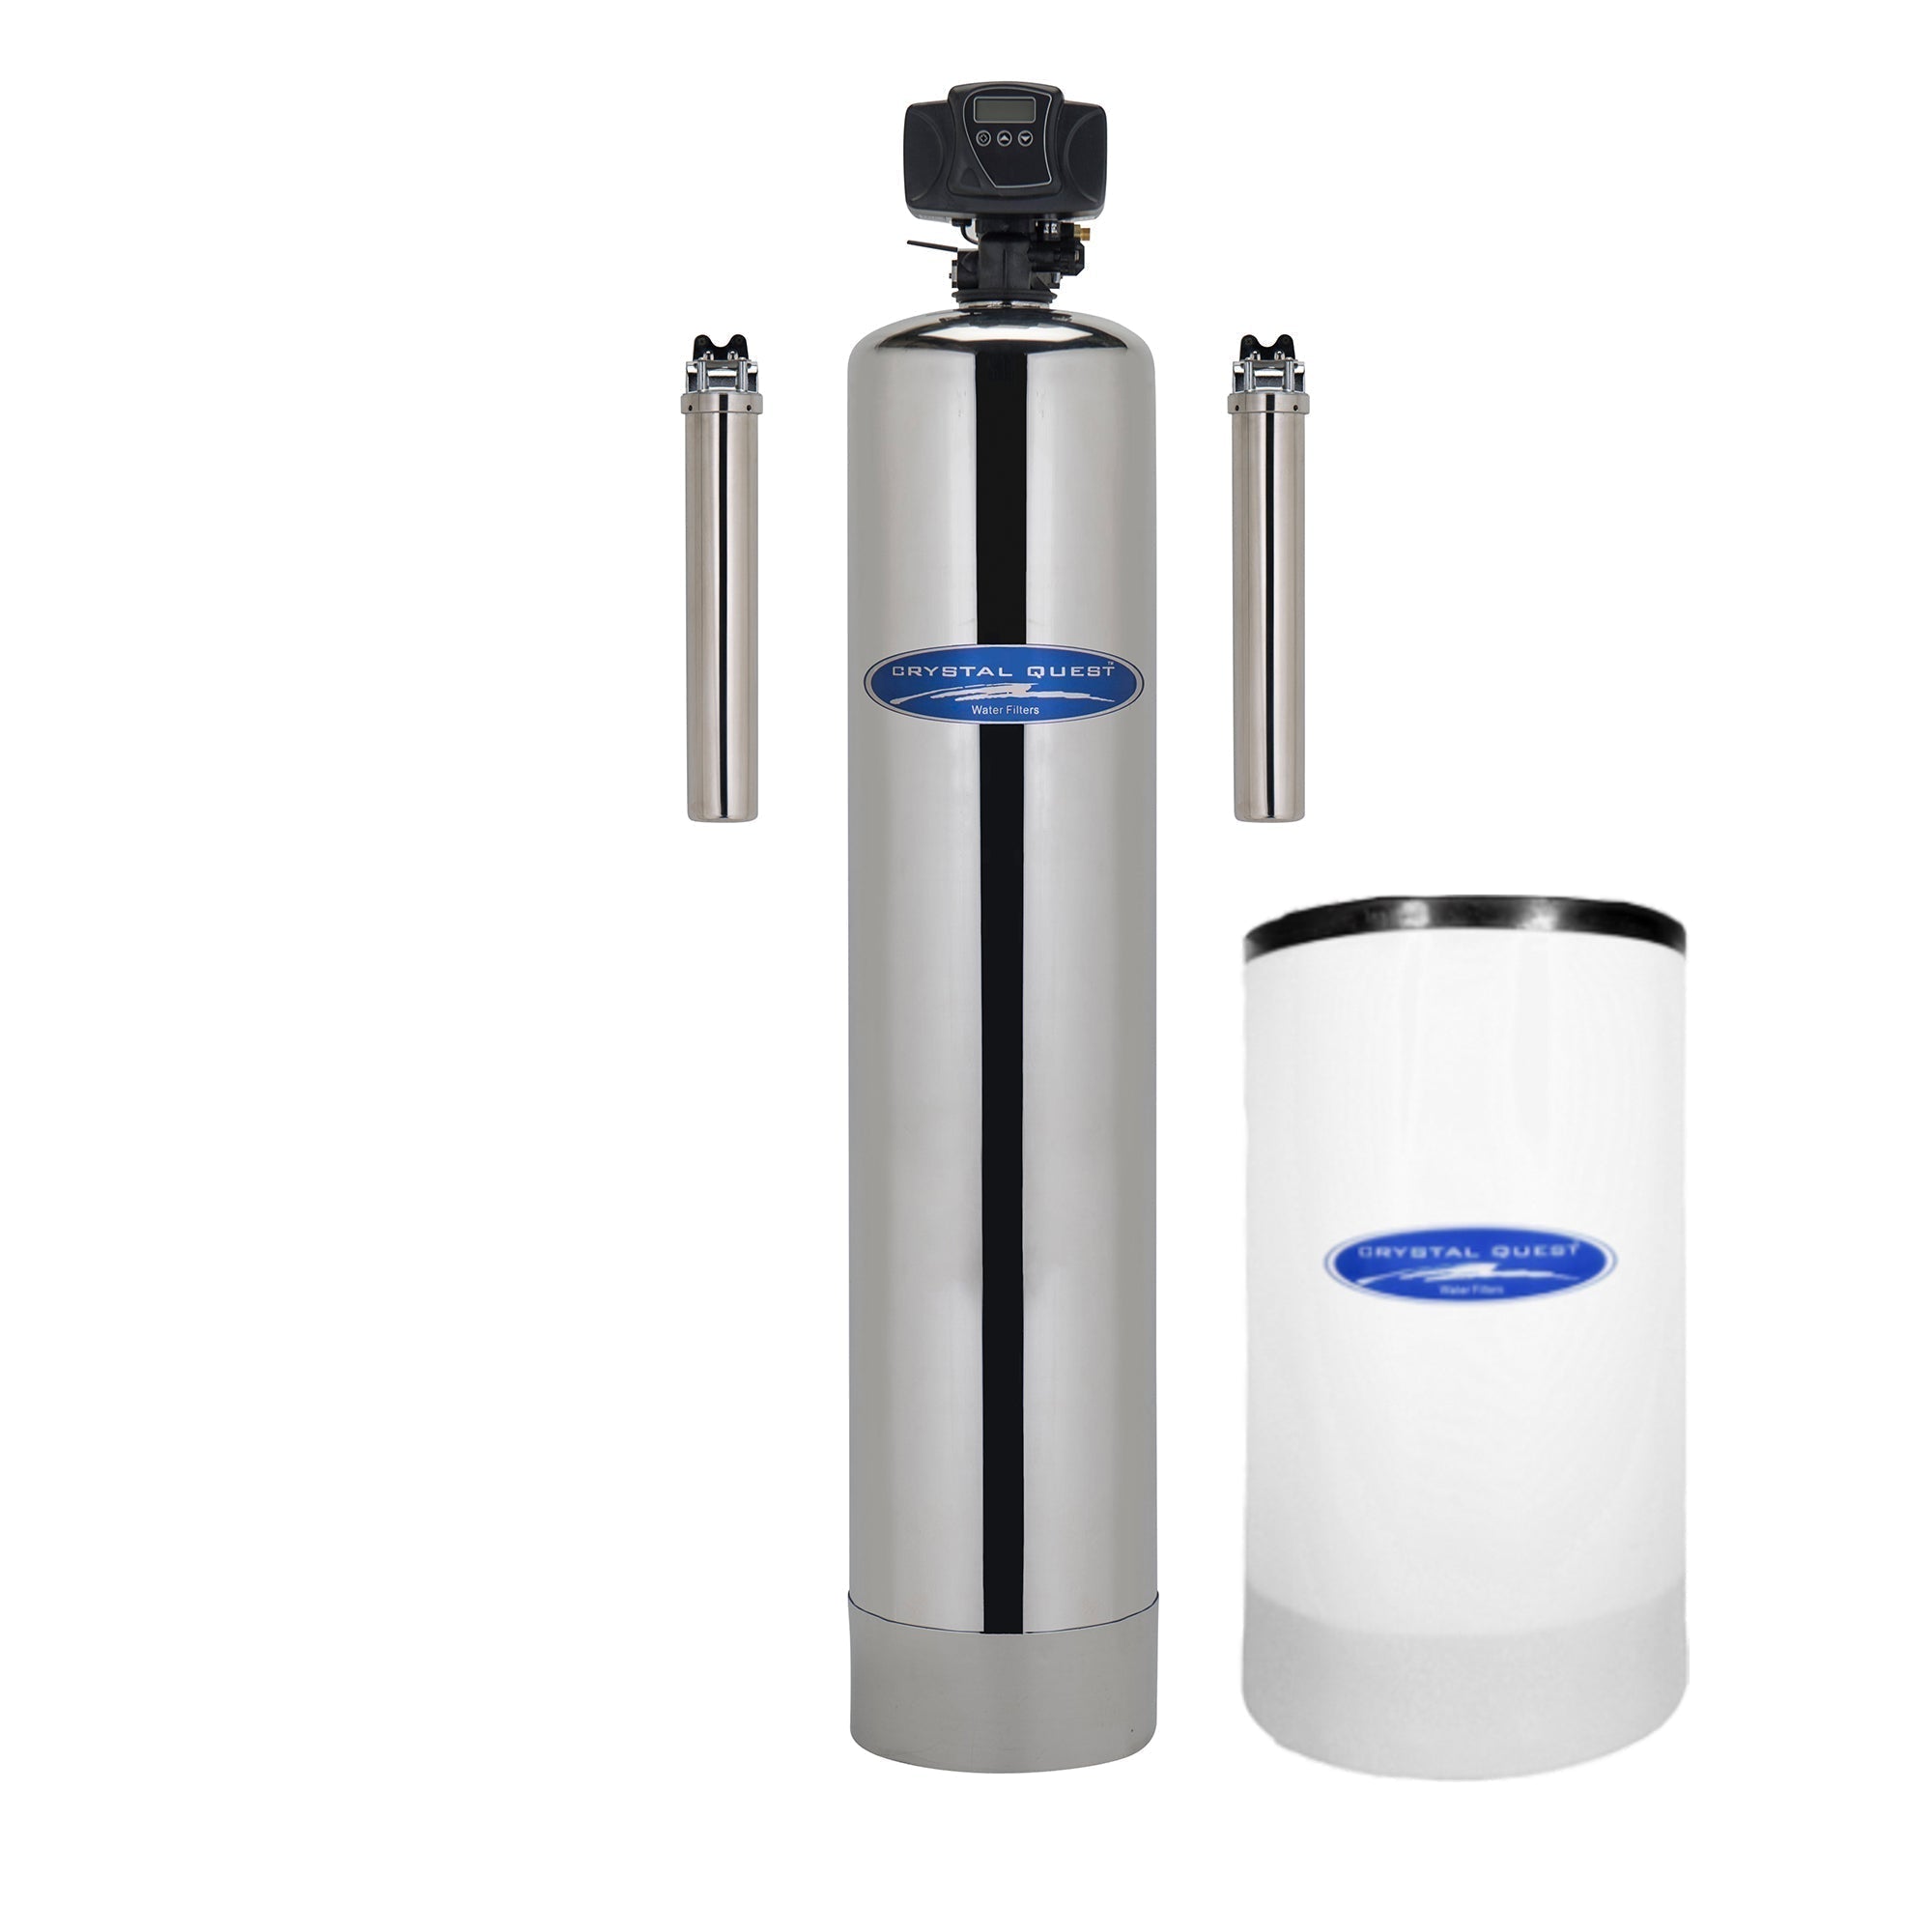
Stainless steel whole-home softener
Optional for hard-water scale and water feel. A softener removes hardness minerals; it is not a general contaminant-removal system.
A softener does not replace a filter selected for a specific contaminant.
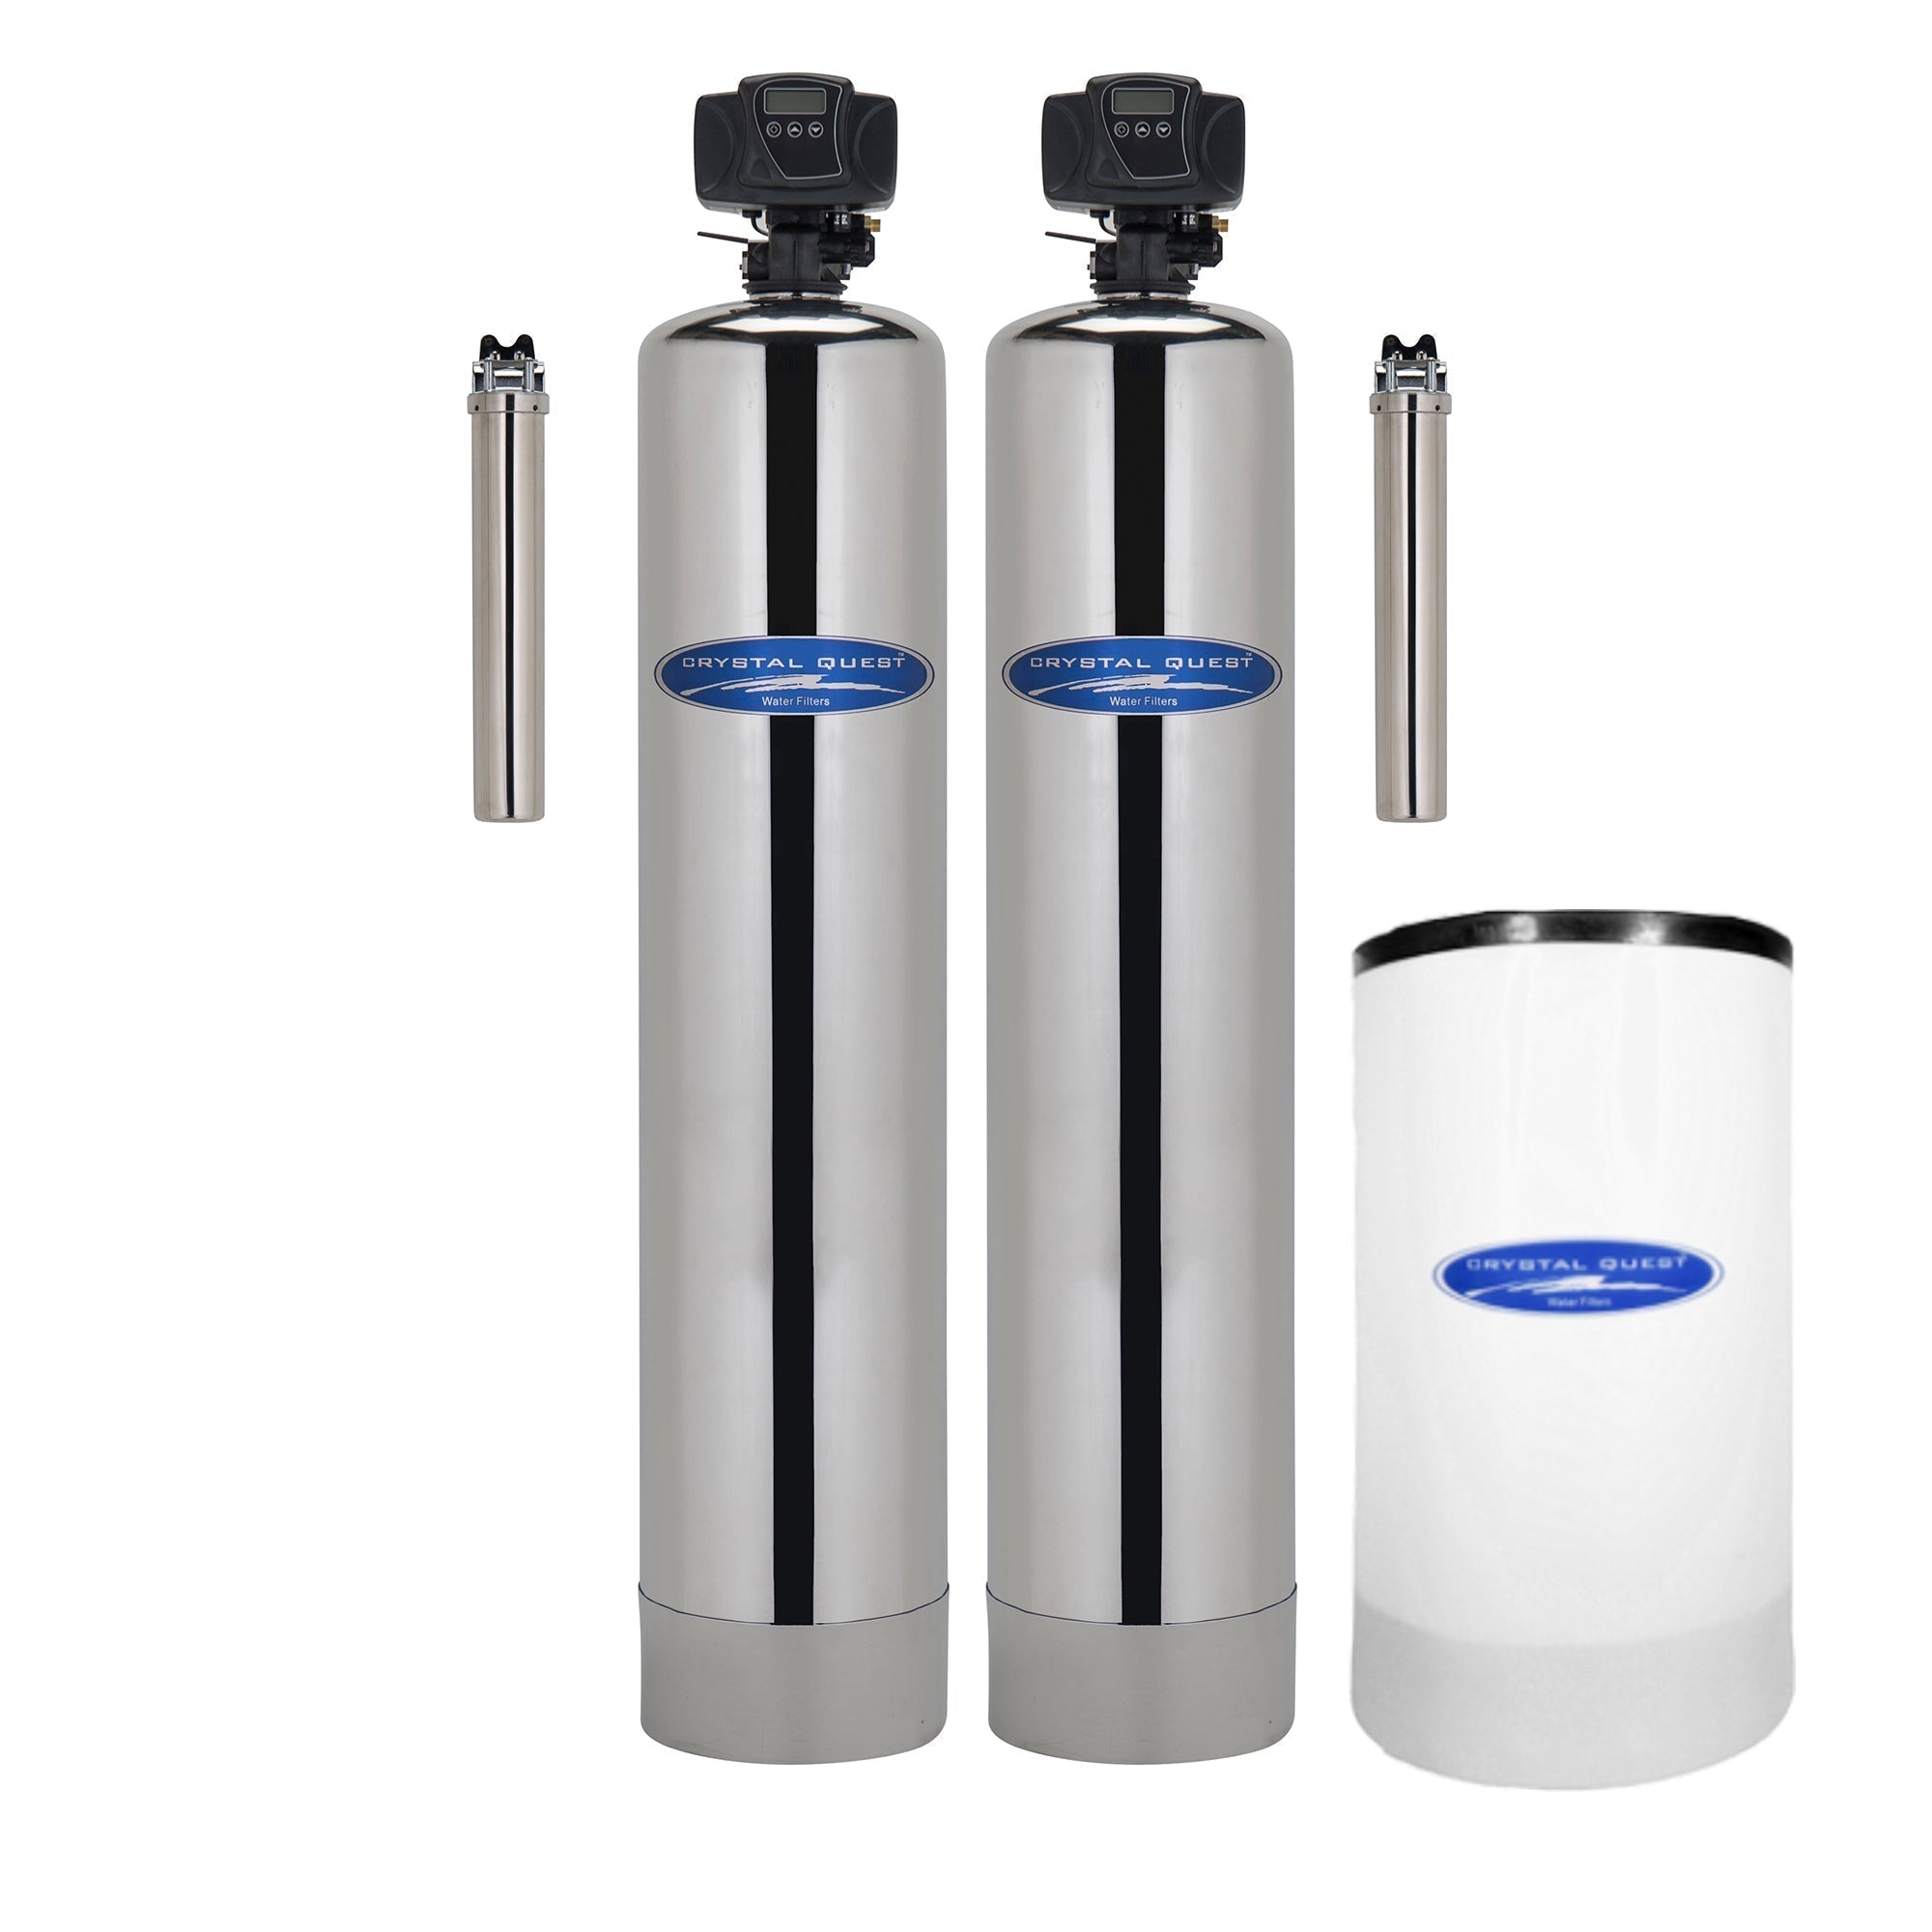
Stainless steel filter + softener
Choose both when filtration and hardness are separate priorities. You can start with the filter in the home-matching flow.
Both units require maintenance, space and a suitable installation.
Equipment pricing includes free U.S. shipping. Installation and applicable taxes are separate. You hire and pay your plumber directly.
For drinking water alone, a suitable kitchen-tap filter may be enough. Keep working equipment that already meets your goal. Wells, shared plumbing and unusually high demand need a separate assessment. No Clearhouse system is claimed to remove every substance in this report. Source
Choose equipment using model-specific performance evidence and maintain it as instructed. Removing disinfectant throughout a home also changes microbial protection in the plumbing. Source
Your water report is the start. Your home decides the fit.
A few household details help narrow the size. Choose “I’m not sure” for any details you don’t know.
- Confirm the name on your water bill.
- Share bathrooms, household size and existing equipment.
- Choose a system. Hire your own plumber.
Want help choosing?
Send your water goals to Clearhouse for a fit review.
Common questions
Is Charlotte County water hard?
The county utility describes its water as moderately hard. It does not give a dated measurement for each system in that FAQ. Englewood’s 78 mg/L figure describes water leaving one treatment plant before blending. Test your incoming water before choosing optional softening. Source
Does a Port Charlotte or Punta Gorda address identify my water provider?
No. A mailing address or ZIP code cannot confirm your water supplier. Check your bill for Charlotte County Utilities, the City of Punta Gorda, Englewood Water District or another provider. Private wells need their own water test. Source
Are the PFAS results current measurements from my home?
No. The county’s 2025 Peace River report includes PFAS monitoring collected in 2023. Those dated utility results are not a current sample from your tap, a promise of filter performance or a current compliance determination. Source
Is a water softener required?
No. Softening is optional and is a separate decision from filtration. Use a home hardness test and your preferences about scale and water feel; your plumber confirms equipment size and settings.
Does this report test my home?
No. Utility reports describe particular systems and sample periods. Plumbing, service lines and treatment already in a home can change the result at the tap.
Will one whole-home filter remove everything listed?
No. Select equipment by its specific tested or certified reduction claims and rated flow. A long contaminant list is not evidence that a particular system removes every item.
Sources & methodology
We transcribe selected utility results and retain sample dates, units, sampling basis and source links. We separate regional supply samples from local distribution data and flag source inconsistencies. Missing data are not treated as non-detections.
Clearhouse sells water treatment equipment and is not a utility or testing laboratory. Report presence alone does not establish a health risk, a need for treatment or a product’s removal performance.
- Charlotte County Utilities · 2025 Peace River water quality report
- Charlotte County Utilities · 2025 Burnt Store water quality report
- Englewood Water District · 2025 water quality report
- Charlotte County Utilities · water hardness and disinfection FAQ
- Englewood Water District · lime-softening plant
- Charlotte County Utilities · report directory
- USGS · hardness of water
- CDC · choosing home water filters
- MyTapWater · Charlotte County Utilities · FL5084100 · Source reviewed October 3, 2026