What’s in Pinellas County’s water?
What the county utility reports—and what it means for your home.
Pinellas County Utilities uses a regional water blend and chloramine disinfection. The tables below keep county utility samples separate from Tampa Bay Water supply results. A Pinellas address alone does not confirm that the county utility serves your home. Source
Email report
Email this water report
Keep a copy for yourself, or share it with someone else.
Email sharing is coming soon. This preview does not send or save email addresses.
Choose the report for your utility
Pinellas County Utilities receives a blend from Tampa Bay Water. Other utilities in the county publish their own reports; use the name on your water bill rather than treating these figures as a countywide measurement.
Match the utility and system on your water bill. A ZIP code or mailing address does not establish service boundaries.
What the reports measured
Browse the selected results by utility. These are substances and indicators—not a count of hazards in your home. Open the linked reports for the complete utility records.
ppm = mg/L; ppb = µg/L; ppt = ng/L. ND means below detection, not zero. MCL and MRDL are regulatory benchmarks reported in the source; action levels trigger system action. Annual averages, individual samples and household-tap percentiles are different measures. Compare like with like.
Sample years stay attached to each result. These historical reports do not replace current utility notices or a test of your tap.
17 report entries
No entries match. Try another search or source.
01Pinellas County UtilitiesReported results, sample dates and source links11
| Substance / indicator | Reported result | Benchmark in source | Sample year / source |
|---|---|---|---|
| Chlorine and chloramines | 3.8 ppmHighest running annual averageIndividual range: 0.30–5.30 ppm | MRDL 4 ppm | 2025 Source |
| TTHM | 41.553 ppbHighest locational running annual averageIndividual range: 31.40–48.63 ppb | MCL 80 ppb | 2025 Source |
| HAA5 | 28.113 ppbHighest locational running annual averageIndividual range: 13.35–35.03 ppb | MCL 60 ppb | 2025 Source |
| Barium | 0.0126 ppmMarch sample | MCL 2 ppm | 2025 Source |
| Chromium · total | 0.8 ppbMarch sample | MCL 100 ppb | 2025 Source |
| FluorideThe report notes fluoridation later stopped; this is a historical result. | 0.60 ppmMarch sample | MCL 4 ppm | 2025 Source |
| Nickel | 3.3 ppbMarch sample | Source MCL 100 ppb | 2025 Source |
| Nitrate · as nitrogen | 0.13 ppmMarch sample | MCL 10 ppm | 2025 Source |
| Sodium | 29.7 ppmMarch sample | Source standard 160 ppm | 2025 Source |
| Lead · household tapsOne sampled site exceeded the action level; the report marks no system action-level exceedance. | 0.8 ppb90th percentile | Action level 15 ppb | 2023 Source |
| Copper · household taps | 0.3 ppm90th percentile | Action level 1.3 ppm | 2023 Source |
02Tampa Bay Water · supplier resultsReported results, sample dates and source links6
| Substance / indicator | Reported result | Benchmark in source | Sample year / source |
|---|---|---|---|
| BromateReported by the regional supplier; not a measurement at your home. | 4.66 ppbHighest running annual averageIndividual range: 2.59–7.18 ppb | MCL 10 ppb | 2025 Source |
| ChloriteReported by the regional supplier; not a measurement at your home. | 0.00782 ppmHighest monthly average | MCL 1 ppm | 2025 Source |
| Alpha emittersReported by the regional supplier; not a measurement at your home. | 3.5 pCi/LHighest reported resultIndividual range: ND–3.5 pCi/L | MCL 15 pCi/L | 2025 Source |
| Combined radiumReported by the regional supplier; not a measurement at your home. | 2.1 pCi/LHighest reported resultIndividual range: 0.6–2.1 pCi/L | MCL 5 pCi/L | 2025 Source |
| DalaponReported by the regional supplier; not a measurement at your home. | 3.4 ppbHighest detected resultIndividual range: ND–3.4 ppb | MCL 200 ppb | 2025 Source |
| Foaming agentsSource marks a secondary-standard violation. Aesthetic standard; supplier sample, not a home result. | 1.80 ppmHighest detected resultIndividual range: ND–1.80 ppm | Secondary standard 0.5 ppm | 2025 Source |
A closer look at your local water
These results describe Pinellas County Utilities (FL6521405), not every home or water system in Pinellas County. Match this system to your water bill before using the results.
Source record: PINELLAS COUNTY UTILITIES · Selected test records: 2015-03-02 – 2024-04-23
Results come from different testing periods. A detection is not, by itself, a finding that water is unsafe. “Not detected” means below the test’s reporting level; it does not mean zero. Missing results mean we have not verified that data here.
PFAS monitoringNone of 29 tested PFAS compounds detected
MyTapWater reports no detections in this panel. Reporting limits vary by compound. The named compounds below are those individually verified in the retrieved source; the full panel is available through the source link. Selected PFAS sample dates: 2023-07-19 – 2024-04-23
28 selected entries
- 11Cl-PF3OUdS
- 4:2 FTS
- 6:2 FTS
- 8:2 FTS
- 9Cl-PF3ONS
- ADONA
- HFPO-DA
- NEtFOSAA
- NFDHA
- NMeFOSAA
- PFBA
- PFBS
- PFDA
- PFDoA
- PFEESA
- PFHpA
- PFHpS
- PFHxA
- PFHxS
- PFMBA
- PFMPA
- PFNA
- PFOA
- PFOS
- PFPeA
- PFPeS
- PFTA
- PFTrDA
Lithium monitoringNot detected
MyTapWater reports lithium was tested and not detected. Selected lithium sample dates: 2023-07-19 – 2024-04-23
More tested substances12 selected entries
Selected historical tests, with their original dates. “Detected” means at least one positive result in the listed period. “Below reporting level” means all retrieved samples for that entry were below the reporting level. These older tests do not describe today’s water at your tap.
| Substance | Reported result | Sampling period |
|---|---|---|
| chlorate | Detected | – |
| chromium-6 | Detected | – |
| chromium | Detected | – |
| strontium | Detected | – |
| vanadium | Detected | – |
| cobalt | Below reporting level | – |
| molybdenum | Below reporting level | – |
| 4-androstene-3,17-dione | Below reporting level | – |
| bromomethane | Below reporting level | – |
| chloromethane | Below reporting level | – |
| equilin | Below reporting level | – |
| estriol | Below reporting level | – |
This is a selection of results from MyTapWater, which compiles public water-system records. Open the source for the complete tables, methods and reporting limits. Check your utility’s latest report and current notices for updates. Source
A list of tested substances is not a list of what a filter removes. Choose a system using its verified contaminant-reduction specifications and your water source. A softener addresses hardness and remains optional.
Do you need a water softener?
No. Softening is optional and is a separate decision from filtration. Use a home hardness test and your preferences about scale and water feel; your plumber confirms equipment size and settings.
Pinellas County Utilities gives a hardness range of 10–15 grains per gallon in its water FAQ. Softening is optional if mineral deposits or water feel matter to you. Confirm your supplier and measure hardness before choosing the settings. Source
Hardness describes dissolved minerals, not an overall water safety score. A filter and a softener do different jobs. Source
Use my water and home detailsPinellas County Utilities · undated FAQ · checked October 2, 2026
Use the source and period shown here. Confirm your supplier and test incoming water before an existing home softener. Source
Softening is an optional choice for scale and water feel.
A filter, a softener, or both?
Choose the job you need done. Size comes next, based on water use and peak flow.
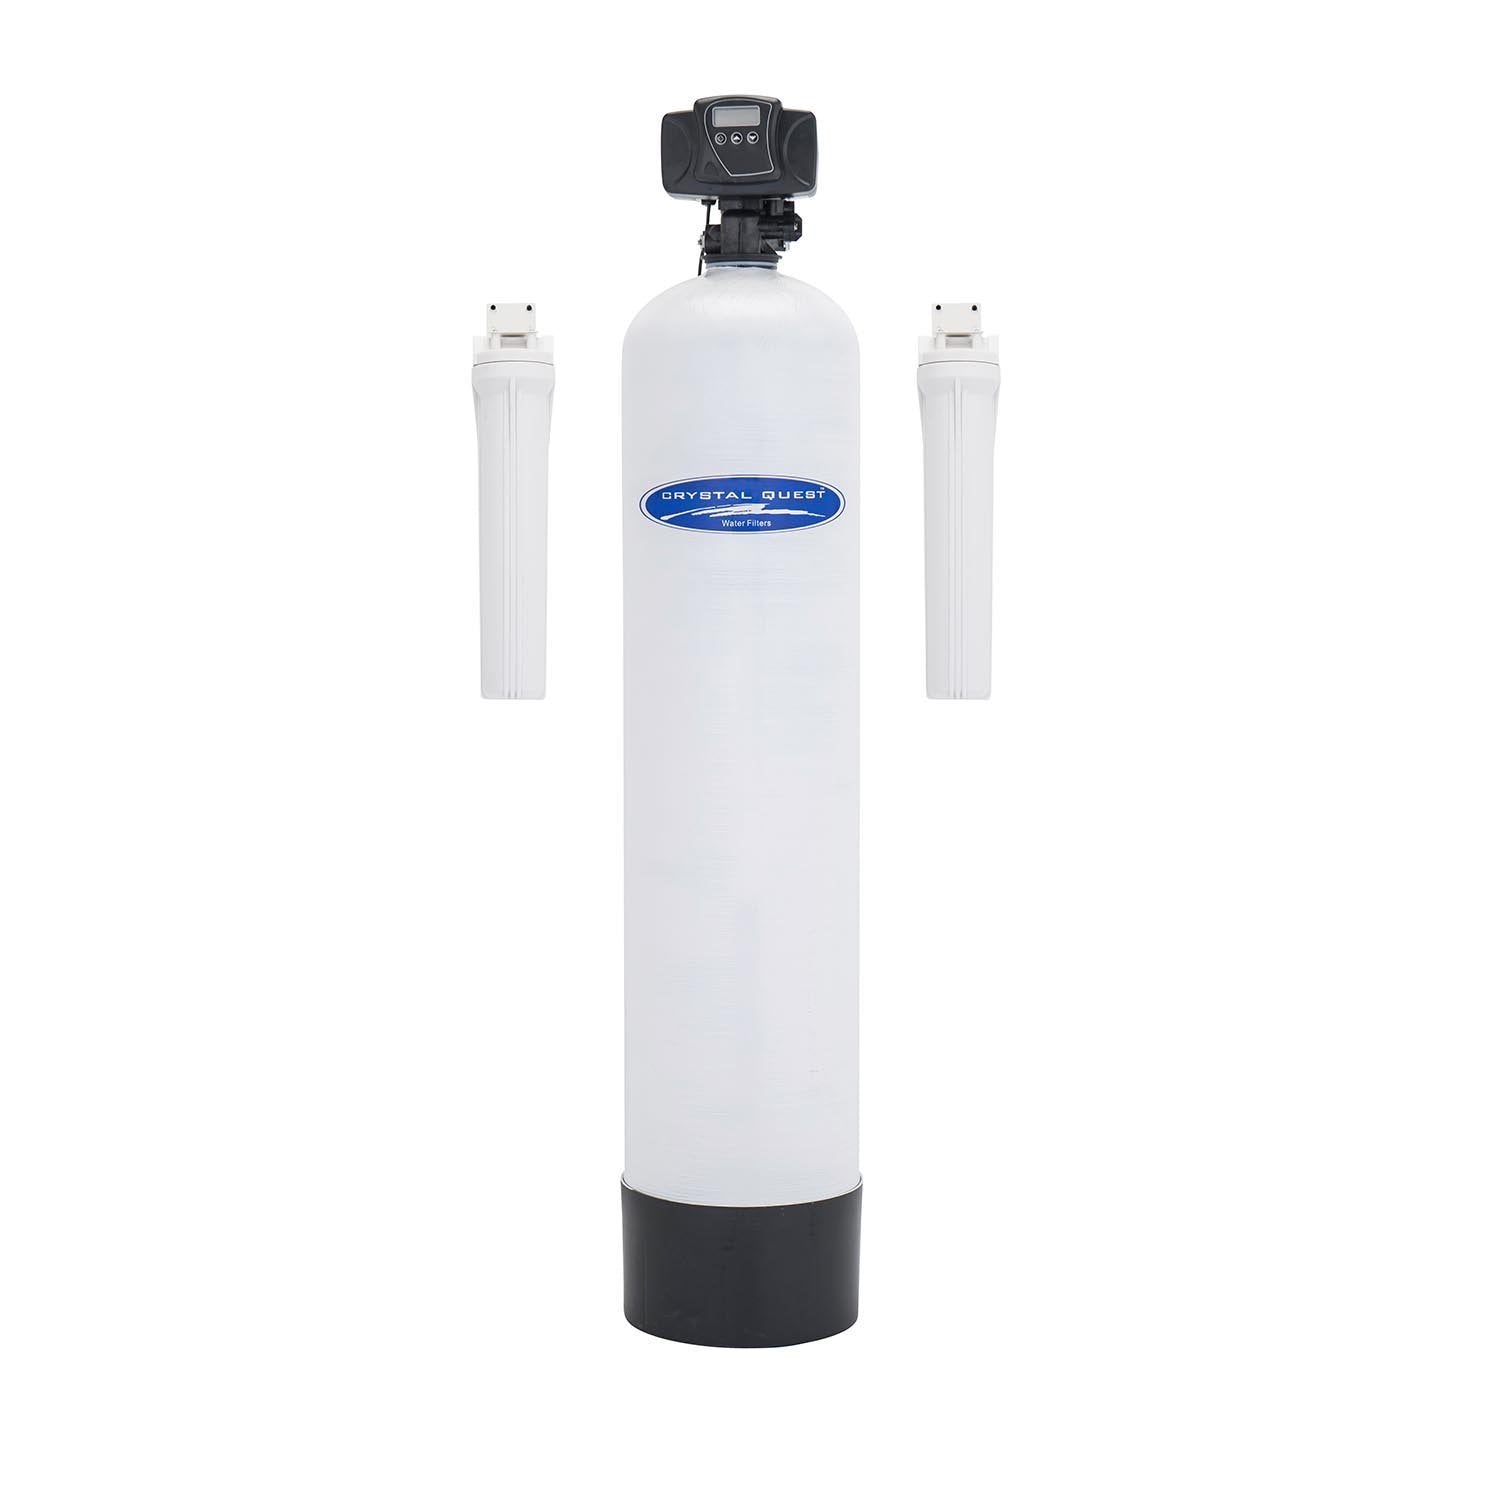
Whole-home filter
For whole-home filtration goals. Match the exact system’s performance claims to the substances you want to address.
A filter alone does not replace a hardness-removing softener.
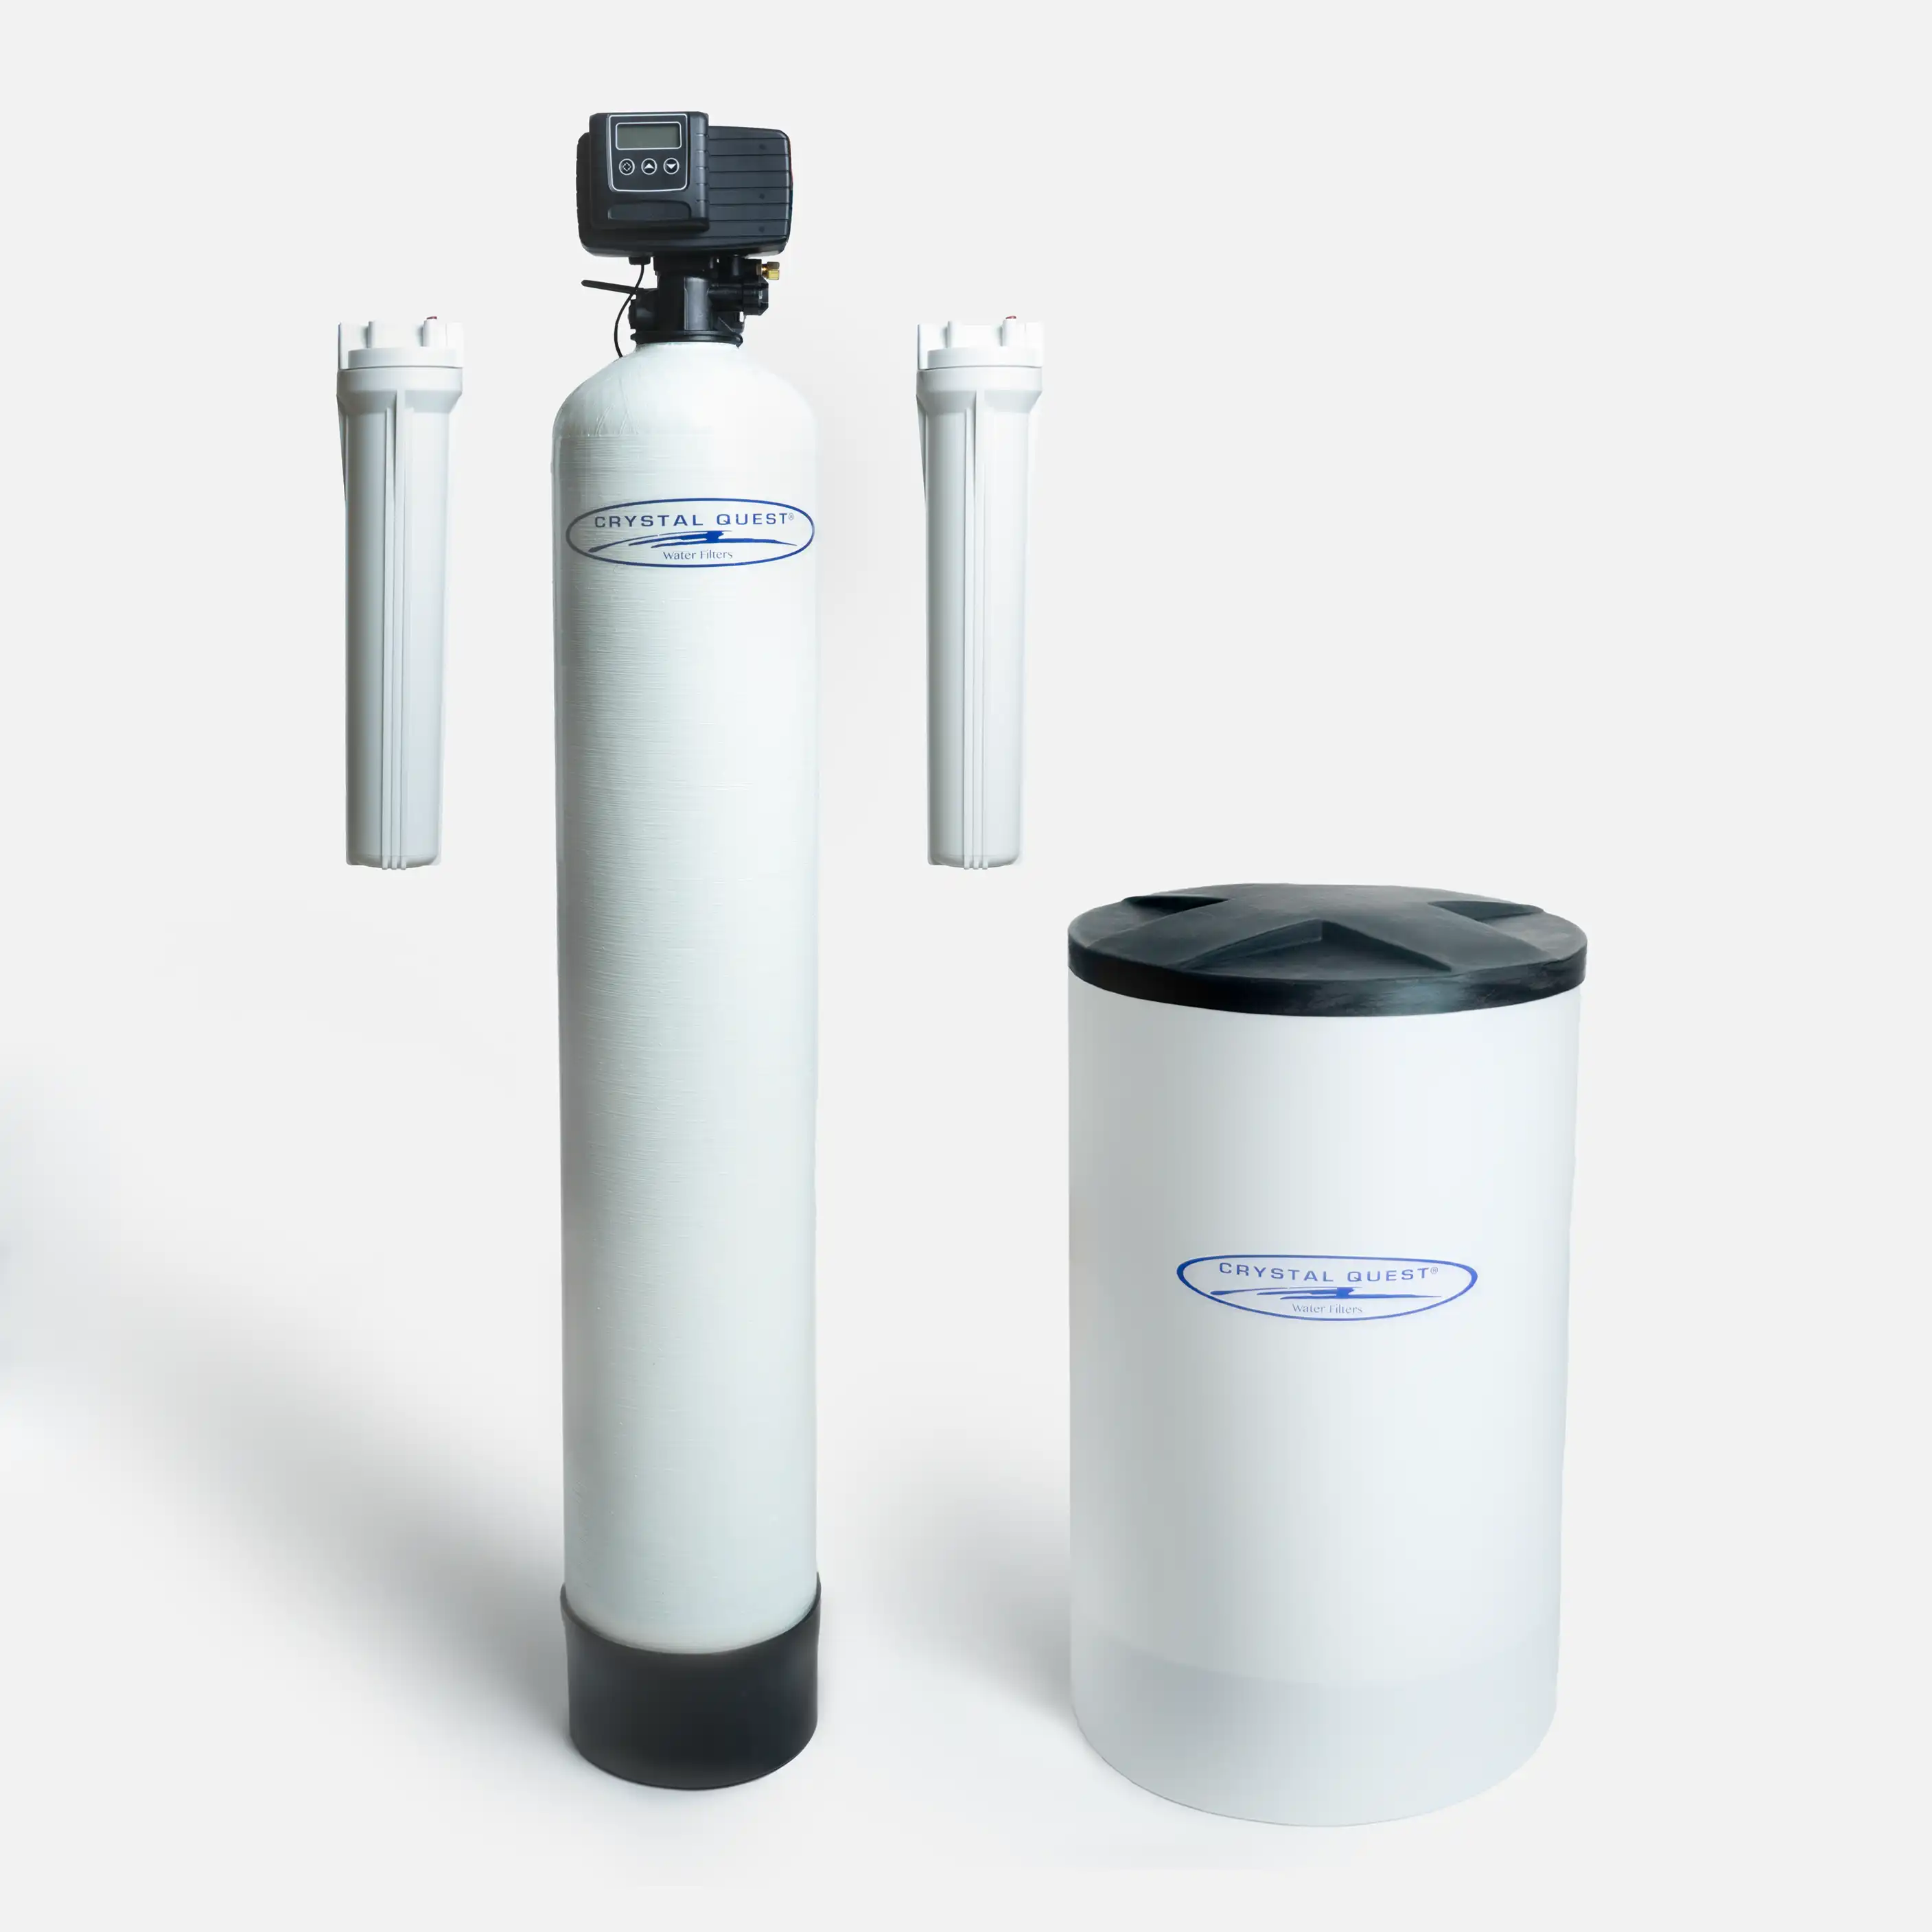
Whole-home softener
Optional for hard-water scale and water feel. A softener removes hardness minerals; it is not a general contaminant-removal system.
A softener does not replace a filter selected for a specific contaminant.
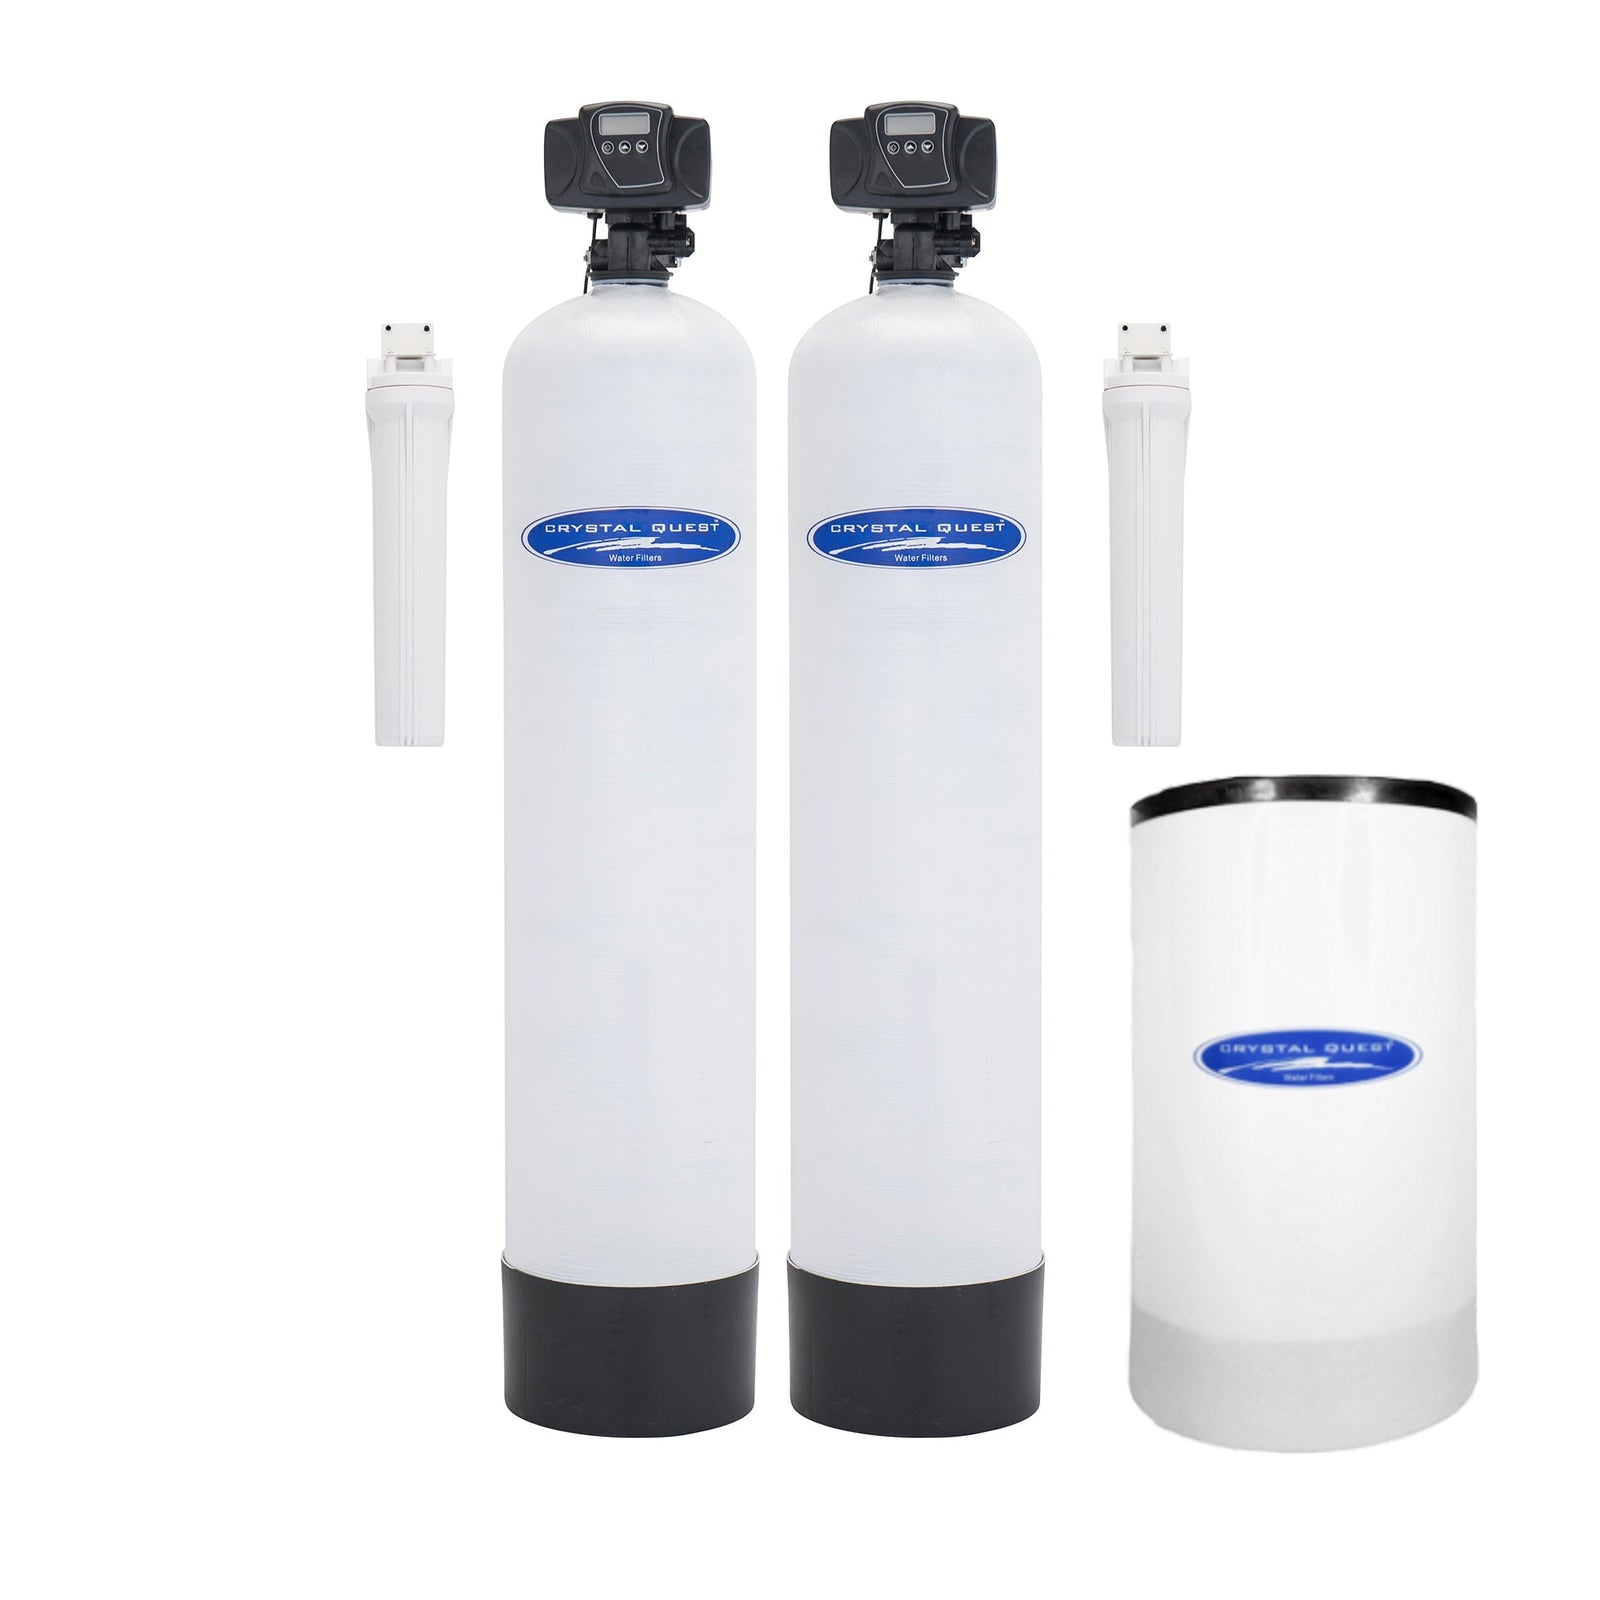
Filter + softener
Choose both when filtration and hardness are separate priorities. You can start with the filter in the home-matching flow.
Both units require maintenance, space and a suitable installation.
Proposed pricing. Installation, shipping and tax are additional. Purchases are paused during the pilot. You hire and pay your plumber directly.
For drinking water alone, a suitable kitchen-tap filter may be enough. Keep working equipment that already meets your goal. Wells, shared plumbing and unusually high demand need a separate assessment. No Clearhouse system is claimed to remove every substance in this report. Source
Choose equipment using model-specific performance evidence and maintain it as instructed. Removing disinfectant throughout a home also changes microbial protection in the plumbing. Source
Your water report is the start. Your home decides the fit.
A few household details help narrow the size. Your street address is optional, and “I’m not sure” is always an option.
- Confirm the name on your water bill.
- Share bathrooms, household size and existing equipment.
- Choose a system. Hire your own plumber.
Want help choosing?
Send your water goals to Clearhouse for a fit review.
Common questions
Are these St. Petersburg or Clearwater results?
These tables identify Pinellas County Utilities and its regional supplier data. If a different utility appears on your bill, use that utility’s report. Shared source water does not make distribution-system results interchangeable. Source
Is a water softener required?
No. Softening is optional and is a separate decision from filtration. Use a home hardness test and your preferences about scale and water feel; your plumber confirms equipment size and settings.
Does this report test my home?
No. Utility reports describe particular systems and sample periods. Plumbing, service lines and treatment already in a home can change the result at the tap.
Will one whole-home filter remove everything listed?
No. Select equipment by its specific tested or certified reduction claims and rated flow. A long contaminant list is not evidence that a particular system removes every item.
Sources & methodology
We transcribe selected utility results and retain sample dates, units, sampling basis and source links. We separate regional supply samples from local distribution data and flag source inconsistencies. Missing data are not treated as non-detections.
Clearhouse sells water treatment equipment and is not a utility or testing laboratory. Report presence alone does not establish a health risk, a need for treatment or a product’s removal performance.
- Pinellas County Utilities · 2025
- County utility hardness guidance
- Source · USGS
- Source · CDC
- MyTapWater · Pinellas County Utilities · FL6521405 · Source reviewed October 3, 2026