What’s in Manatee County’s water?
Understand the water. Choose what your home actually needs.
Manatee County Utilities’ 2025 report lists chloramines, disinfection byproducts and trace contaminants. Hardness varied from 6.2 to 16.3 grains per gallon. The listed compliance tables report no violations. [1] [2]
Email report
Email this water report
Keep a copy for yourself, or share it with someone else.
Email sharing is coming soon. This preview does not send or save email addresses.
One county. More than one water system.
These results describe Manatee County Utilities. Check the supplier name on your water bill before using the numbers to choose a system. A ZIP code or a Bradenton, Lakewood Ranch or Parrish mailing address alone cannot confirm your supplier.
City of Bradenton customers should use the city’s report. Palmetto buys county water and operates its own distribution system. Private wells need a separate water test. [7] [8] [5]
More detail. Less guesswork.
Explore the reported measurements and tests with no detection. Every group links to the original utility document.
Detection does not automatically mean a violation. Annual averages, individual maxima and household sampling statistics answer different questions. Benchmarks below are those printed in the source reports, not a separate claim about today’s rules.
ppm = mg/L; ppb = µg/L. ND means not detected by the reported test; < MRL means below the minimum reporting level. Neither means zero. MCLG is a health goal, not an enforceable limit. [1] [3]
163 report entries across four groups
01Contaminants & treatment measurements2025 · metals, byproducts, pesticides and treatment indicators26
| Substance / measure | Reported result | Benchmark in source | Year / source |
|---|---|---|---|
| ChloraminesIndividual samples and the annual compliance average are different measures. The report lists no violation. | 3.3 ppmHighest running annual averageRange: ND–5.3 ppm | MRDL 4 ppm | 2025 [1] |
| Total trihalomethanes (TTHM) | 47.1 ppbHighest locational annual averageRange: 13.8–57.4 ppb | MCL 80 ppb | 2025 [1] |
| Haloacetic acids (HAA5) | 39.5 ppbHighest locational annual averageRange: 3.3–44.4 ppb | MCL 60 ppb | 2025 [1] |
| Lead · sampled household tapsNo sampled sites exceeded the action level. This is not a measurement at your home. | 1.1 ppb90th percentile · Jun–Sep 2025 | Action level 15 ppbMCLG 0 ppb | 2025 [1] |
| Copper · sampled household tapsNo sampled sites exceeded the action level. | 0.18 ppm90th percentile · Jun–Sep 2025 | Action level 1.3 ppm | 2025 [1] |
| Antimony | 0.38 ppbHighest resultRange: ND–0.38 ppb | MCL 6 ppb | 2025 [1] |
| Barium | 0.013 ppmHighest resultRange: 0.0093–0.013 ppm | MCL 2 ppm | 2025 [1] |
| Chromium · totalThe 2025 report lists total chromium; this is not a separate hexavalent chromium result. | 0.57 ppbHighest resultRange: ND–0.57 ppb | MCL 100 ppb | 2025 [1] |
| Cyanide | 31 ppbHighest resultRange: ND–31 ppb | MCL 200 ppb | 2025 [1] |
| Fluoride | 0.32 ppmHighest resultRange: ND–0.32 ppm | MCL 4 ppm | 2025 [1] |
| Lead · point of entryEntry-point data are separate from the household-tap lead samples. The source places this value in its MCL column; household lead compliance uses an action level. | 0.70 ppbHighest resultRange: ND–0.70 ppb | Source lists 15 ppbMCLG 0 ppb | 2025 [1] |
| Nickel | 1.1 ppbHighest resultRange: ND–1.1 ppb | Source MCL 100 ppb | 2025 [1] |
| Nitrate · as nitrogen | 0.27 ppmHighest resultRange: 0.12–0.27 ppm | MCL 10 ppm | 2025 [1] |
| Selenium | 3.7 ppbHighest resultRange: ND–3.7 ppb | MCL 50 ppb | 2025 [1] |
| Sodium | 15.0 ppmHighest resultRange: 13.0–15.0 ppm | Source MCL 160 ppm | 2025 [1] |
| Gross alpha · including uranium | 2.57 pCi/LHighest resultRange: ND–2.57 pCi/L | MCL 15 pCi/LMCLG 0 pCi/L | 2025 [1] |
| Radium-226The 5 pCi/L limit applies to radium-226 plus radium-228, not to each isotope separately. | 0.69 pCi/LHighest resultRange: 0.42–0.69 pCi/L | Combined radium MCL 5 pCi/LMCLG 0 pCi/L | 2025 [1] |
| Radium-228The 5 pCi/L limit applies to radium-226 plus radium-228, not to each isotope separately. | 0.78 pCi/LHighest resultRange: ND–0.78 pCi/L | Combined radium MCL 5 pCi/LMCLG 0 pCi/L | 2025 [1] |
| 2,4-D | 0.17 ppbHighest resultRange: ND–0.17 ppb | MCL 70 ppb | 2025 [1] |
| Atrazine | 0.03 ppbHighest resultRange: ND–0.03 ppb | MCL 3 ppb | 2025 [1] |
| Dalapon | 0.62 ppbHighest resultRange: ND–0.62 ppb | MCL 200 ppb | 2025 [1] |
| Hexachlorocyclopentadiene | 0.03 ppbHighest resultRange: ND–0.03 ppb | MCL 50 ppb | 2025 [1] |
| Dichloromethane | 0.52 ppbHighest resultRange: ND–0.52 ppb | MCL 5 ppbMCLG 0 ppb | 2025 [1] |
| Filter turbidityLowest monthly proportion meeting the treatment limit: 99.5%. The report lists no treatment-technique violation. | 0.44 NTUHighest single measurement | Treatment technique | 2025 [1] |
| Total organic carbon · removal ratioThis is a treatment-performance ratio, not a contaminant concentration. | 1.28 ratioLowest running annual averageRange: 1.20–1.54 ratio | Removal ratio above 1.0 | 2025 [1] |
| RadonThe report gives inconsistent quarter/month wording, so this page preserves only the annual context and results. A proposed value is not treated as an enforceable limit. | 11.2 and 40.8 pCi/LTwo detections in four quarterly samples | No federal limit stated | 2025 [1] |
02Minerals, taste & additional results2025 · hardness, dissolved solids and other measurements15
| Substance / measure | Reported result | Benchmark in source | Year / source |
|---|---|---|---|
| Total hardness | 279 ppm as CaCO₃Highest resultRange: 106–279 ppm as CaCO₃ | No health-based limit | 2025 [2] |
| Total alkalinity | 61.0 ppm as CaCO₃Highest resultRange: 20.1–61.0 ppm as CaCO₃ | Not regulated in source | 2025 [2] |
| Total dissolved solids | 280 ppmHighest resultRange: 110–280 ppm | Secondary standard 500 ppm | 2025 [2] |
| Aluminum | 0.068 ppmHighest resultRange: 0.025–0.068 ppm | Secondary standard 0.2 ppm | 2025 [2] |
| Chloride | 20 ppmHighest resultRange: 18–20 ppm | Secondary standard 250 ppm | 2025 [2] |
| Color | 5 CUHighest resultRange: ND–5 CU | Secondary standard 15 CU | 2025 [2] |
| Copper · finished water | 0.0023 ppmHighest resultRange: 0.00093–0.0023 ppm | Secondary standard 1 ppm | 2025 [2] |
| Foaming agents | 0.10 ppmHighest resultRange: ND–0.10 ppm | Secondary standard 0.5 ppm | 2025 [2] |
| Manganese | 0.011 ppmHighest resultRange: ND–0.011 ppm | Secondary standard 0.05 ppm | 2025 [2] |
| Silver | 0.0016 ppmHighest resultRange: ND–0.0016 ppm | Secondary standard 0.1 ppm | 2025 [2] |
| Sulfate | 150 ppmHighest resultRange: ND–150 ppm | Secondary standard 250 ppm | 2025 [2] |
| Zinc | 0.13 ppmHighest resultRange: 0.034–0.13 ppm | Secondary standard 5 ppm | 2025 [2] |
| Butyl benzyl phthalate | 0.41 ppbHighest resultRange: ND–0.41 ppb | Not regulated in source | 2025 [2] |
| Di-n-butyl phthalate | 0.23 ppbHighest resultRange: ND–0.23 ppb | Not regulated in source | 2025 [2] |
| Metolachlor | 0.37 ppbHighest resultRange: 0.035–0.37 ppb | Not regulated in source | 2025 [2] |
03PFAS & lithium monitoring2024 · below minimum reporting levels29
| Substance / measure | Reported result | Benchmark in source | Year / source |
|---|---|---|---|
| Lithium | < MRL ppbBelow EPA minimum reporting level | Numeric MRL not supplied | 2024 [3] |
| 11Cl-PF3OUdS | < MRL ppbBelow EPA minimum reporting level | Numeric MRL not supplied | 2024 [3] |
| 4:2 FTS | < MRL ppbBelow EPA minimum reporting level | Numeric MRL not supplied | 2024 [3] |
| 6:2 FTS | < MRL ppbBelow EPA minimum reporting level | Numeric MRL not supplied | 2024 [3] |
| 8:2 FTS | < MRL ppbBelow EPA minimum reporting level | Numeric MRL not supplied | 2024 [3] |
| 9Cl-PF3ONS | < MRL ppbBelow EPA minimum reporting level | Numeric MRL not supplied | 2024 [3] |
| ADONA | < MRL ppbBelow EPA minimum reporting level | Numeric MRL not supplied | 2024 [3] |
| HFPO-DA (GenX) | < MRL ppbBelow EPA minimum reporting level | Numeric MRL not supplied | 2024 [3] |
| NFDHA | < MRL ppbBelow EPA minimum reporting level | Numeric MRL not supplied | 2024 [3] |
| PFBA | < MRL ppbBelow EPA minimum reporting level | Numeric MRL not supplied | 2024 [3] |
| PFBS | < MRL ppbBelow EPA minimum reporting level | Numeric MRL not supplied | 2024 [3] |
| PFDA | < MRL ppbBelow EPA minimum reporting level | Numeric MRL not supplied | 2024 [3] |
| PFDoA | < MRL ppbBelow EPA minimum reporting level | Numeric MRL not supplied | 2024 [3] |
| PFEESA | < MRL ppbBelow EPA minimum reporting level | Numeric MRL not supplied | 2024 [3] |
| PFHpA | < MRL ppbBelow EPA minimum reporting level | Numeric MRL not supplied | 2024 [3] |
| PFHpS | < MRL ppbBelow EPA minimum reporting level | Numeric MRL not supplied | 2024 [3] |
| PFHxA | < MRL ppbBelow EPA minimum reporting level | Numeric MRL not supplied | 2024 [3] |
| PFHxS | < MRL ppbBelow EPA minimum reporting level | Numeric MRL not supplied | 2024 [3] |
| PFMBA | < MRL ppbBelow EPA minimum reporting level | Numeric MRL not supplied | 2024 [3] |
| PFMPA | < MRL ppbBelow EPA minimum reporting level | Numeric MRL not supplied | 2024 [3] |
| PFNA | < MRL ppbBelow EPA minimum reporting level | Numeric MRL not supplied | 2024 [3] |
| PFOA | < MRL ppbBelow EPA minimum reporting level | Numeric MRL not supplied | 2024 [3] |
| PFOS | < MRL ppbBelow EPA minimum reporting level | Numeric MRL not supplied | 2024 [3] |
| PFPeA | < MRL ppbBelow EPA minimum reporting level | Numeric MRL not supplied | 2024 [3] |
| PFUnA | < MRL ppbBelow EPA minimum reporting level | Numeric MRL not supplied | 2024 [3] |
| NEtFOSAA | < MRL ppbBelow EPA minimum reporting level | Numeric MRL not supplied | 2024 [3] |
| NMeFOSAA | < MRL ppbBelow EPA minimum reporting level | Numeric MRL not supplied | 2024 [3] |
| PFTA | < MRL ppbBelow EPA minimum reporting level | Numeric MRL not supplied | 2024 [3] |
| PFTrDA | < MRL ppbBelow EPA minimum reporting level | Numeric MRL not supplied | 2024 [3] |
04Other tests with no detection2025 · substances and parameters listed as not detected93
- Nitrite
- Arsenic
- Cadmium
- Mercury
- Beryllium
- Thallium
- Iron
- Odor
- Combined uranium
- 1,2,4-Trichlorobenzene
- cis-1,2-Dichloroethylene
- Xylenes
- o-Dichlorobenzene
- para-Dichlorobenzene
- Vinyl chloride
- 1,1-Dichloroethylene
- trans-1,2-Dichloroethylene
- 1,2-Dichloroethane
- 1,1,1-Trichloroethane
- Carbon tetrachloride
- 1,2-Dichloropropane
- Trichloroethylene
- 1,1,2-Trichloroethane
- Tetrachloroethylene
- Monochlorobenzene
- Benzene
- Toluene
- Ethylbenzene
- Styrene
- Endrin
- Lindane
- Methoxychlor
- Toxaphene
- Diquat
- Endothall
- Glyphosate
- Di(2-ethylhexyl)adipate
- Oxamyl
- Simazine
- Di(2-ethylhexyl)phthalate
- Picloram
- Dinoseb
- Carbofuran
- Alachlor
- 2,3,7,8-TCDD (dioxin)
- Heptachlor
- Heptachlor epoxide
- 2,4,5-TP (silvex)
- Hexachlorobenzene
- Benzo(a)pyrene
- Pentachlorophenol
- PCBs
- Dibromochloropropane
- Ethylene dibromide (EDB)
- Chlordane
- Dicamba
- 1,1,1,2-Tetrachloroethane
- 1,1,2,2-Tetrachloroethane
- 1,1-Dichloroethane
- 1,1-Dichloropropene
- 1,2,3-Trichloropropane
- 1,3-Dichlorobenzene
- 1,3-Dichloropropane
- 2,2-Dichloropropane
- 2-Chlorotoluene
- 4-Chlorotoluene
- Bromobenzene
- Bromomethane
- Chloroethane
- Chloromethane
- Dibromomethane
- Dichlorodifluoromethane
- Methyl tert-butyl ether
- Trichlorofluoromethane
- Aldrin
- Dieldrin
- Metribuzin
- Propachlor
- 3-Hydroxycarbofuran
- Aldicarb
- Aldicarb sulfone
- Aldicarb sulfoxide
- Carbaryl
- Methomyl
- 2,4,6-Trichlorophenol
- 2,4-Dinitrotoluene
- 2-Chlorophenol
- 4,6-Dinitro-2-methylphenol
- Diethylphthalate
- Dimethylphthalate
- Di-n-octylphthalate
- Isophorone
- Phenol
No matching entries. Try a shorter name or choose All results. A missing entry is not proof that a substance was tested or absent.
Counts are report entries, not a count of dangerous contaminants. Some substances appear in different sampling contexts. The fluoride result is shown once; the additional report also lists a 2 ppm secondary standard. [2]
A closer look at your local water
These results describe Manatee County Utilities (FL6411132), not every home or water system in Manatee County. Match this system to your water bill before using the results.
Source record: MANATEE COUNTY UTILITIES DEPT · Selected test records: 2013-01-23 – 2024-11-20
Results come from different testing periods. A detection is not, by itself, a finding that water is unsafe. “Not detected” means below the test’s reporting level; it does not mean zero. Missing results mean we have not verified that data here.
PFAS monitoringNone of 29 tested PFAS compounds detected
MyTapWater reports no detections in this panel. Reporting limits vary by compound. The named compounds below are those individually verified in the retrieved source; the full panel is available through the source link. Selected PFAS sample dates: 2024-01-17 – 2024-11-20
10 selected entries
- NEtFOSAA
- NMeFOSAA
- PFBS
- PFHpA
- PFHxS
- PFNA
- PFOA
- PFOS
- PFTA
- PFTrDA
Lithium monitoringNot detected
MyTapWater reports lithium was tested and not detected. Selected lithium sample dates: 2024-01-17 – 2024-10-21
More tested substances12 selected entries
Selected historical tests, with their original dates. “Detected” means at least one positive result in the listed period. “Below reporting level” means all retrieved samples for that entry were below the reporting level. These older tests do not describe today’s water at your tap.
| Substance | Reported result | Sampling period |
|---|---|---|
| HAA5 | Detected | – |
| HAA6Br | Detected | – |
| HAA9 | Detected | – |
| strontium | Detected | – |
| chlorate | Detected | – |
| chromium | Detected | – |
| chromium-6 | Detected | – |
| molybdenum | Detected | – |
| vanadium | Detected | – |
| chlorpyrifos | Below reporting level | – |
| dimethipin | Below reporting level | – |
| ethoprop | Below reporting level | – |
This is a selection of results from MyTapWater, which compiles public water-system records. Open the source for the complete tables, methods and reporting limits. Check your utility’s latest report and current notices for updates. Source
A list of tested substances is not a list of what a filter removes. Choose a system using its verified contaminant-reduction specifications and your water source. A softener addresses hardness and remains optional.
Do you need a water softener in Manatee County?
If scale and mineral spots are the problem, check your home’s hardness first.
The utility’s 2025 range, 106–279 mg/L as CaCO₃, crosses several USGS hardness categories. A single county average would hide that variation. A test of untreated water gives you a better basis for choosing a softener. [2] [4]
Hardness concerns calcium and magnesium minerals. It can cause scale and affect cleaning, but hardness itself is not a health-contaminant score. [4]
Use my water and home detailsA filter, a softener, or both?
Choose the job you need done. Size comes next, based on water use and peak flow.
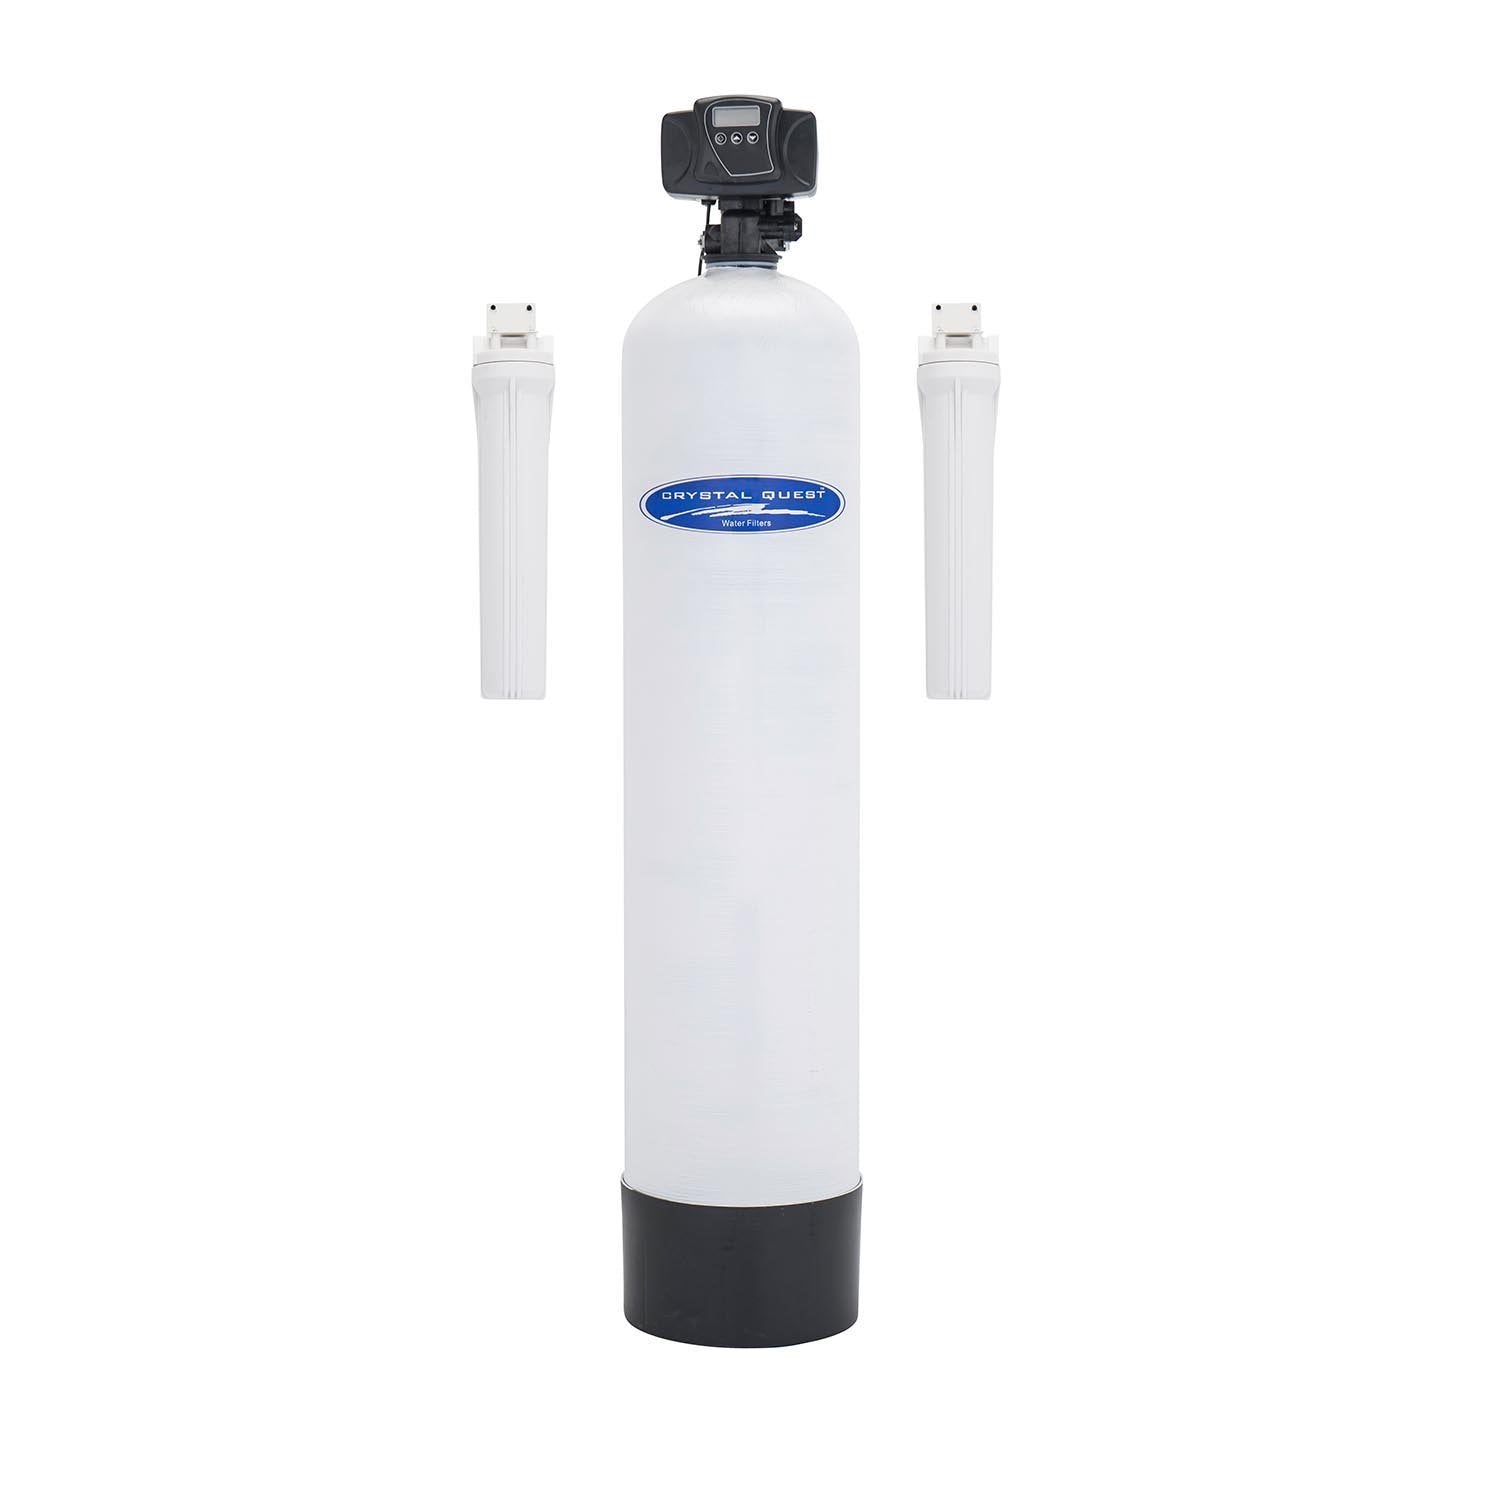
Whole-home filter
You want to address taste or odor across the home. Confirm the exact model’s chloramine performance before choosing.
A filter alone does not replace a hardness-removing softener.
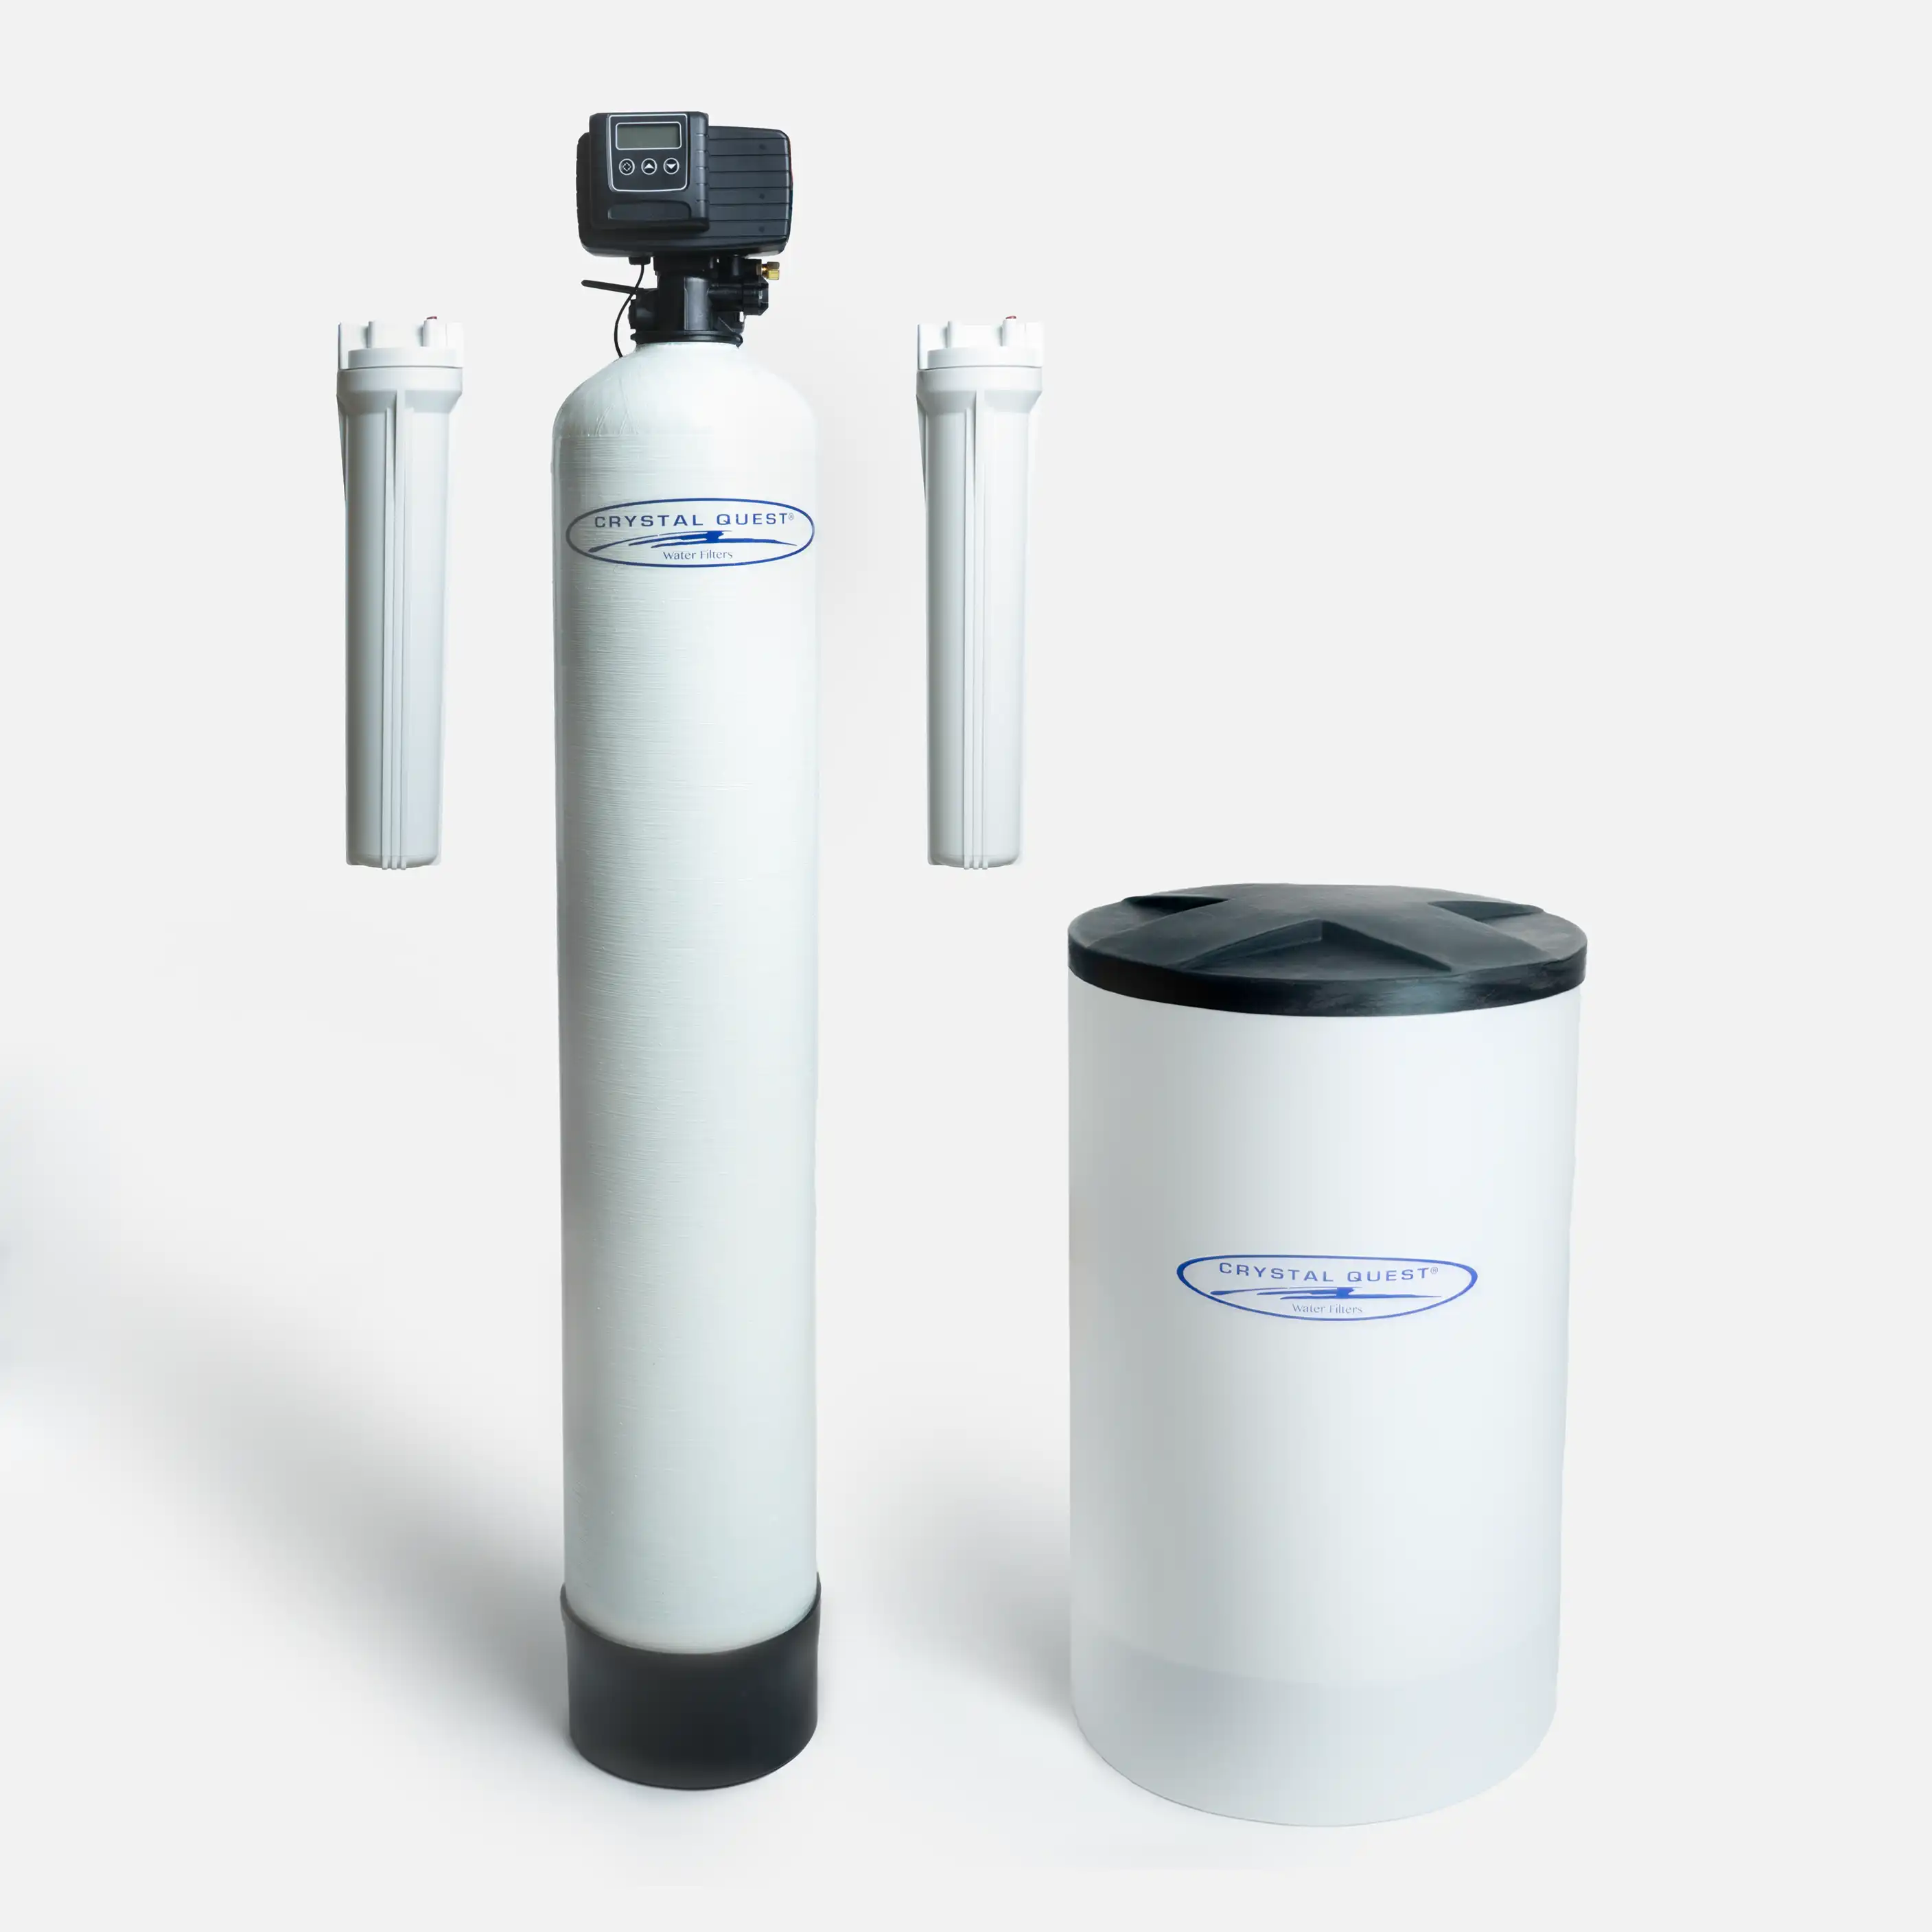
Whole-home softener
A home test confirms hard water, and scale or mineral spots are your main concern.
A softener does not replace a filter selected for a specific contaminant.
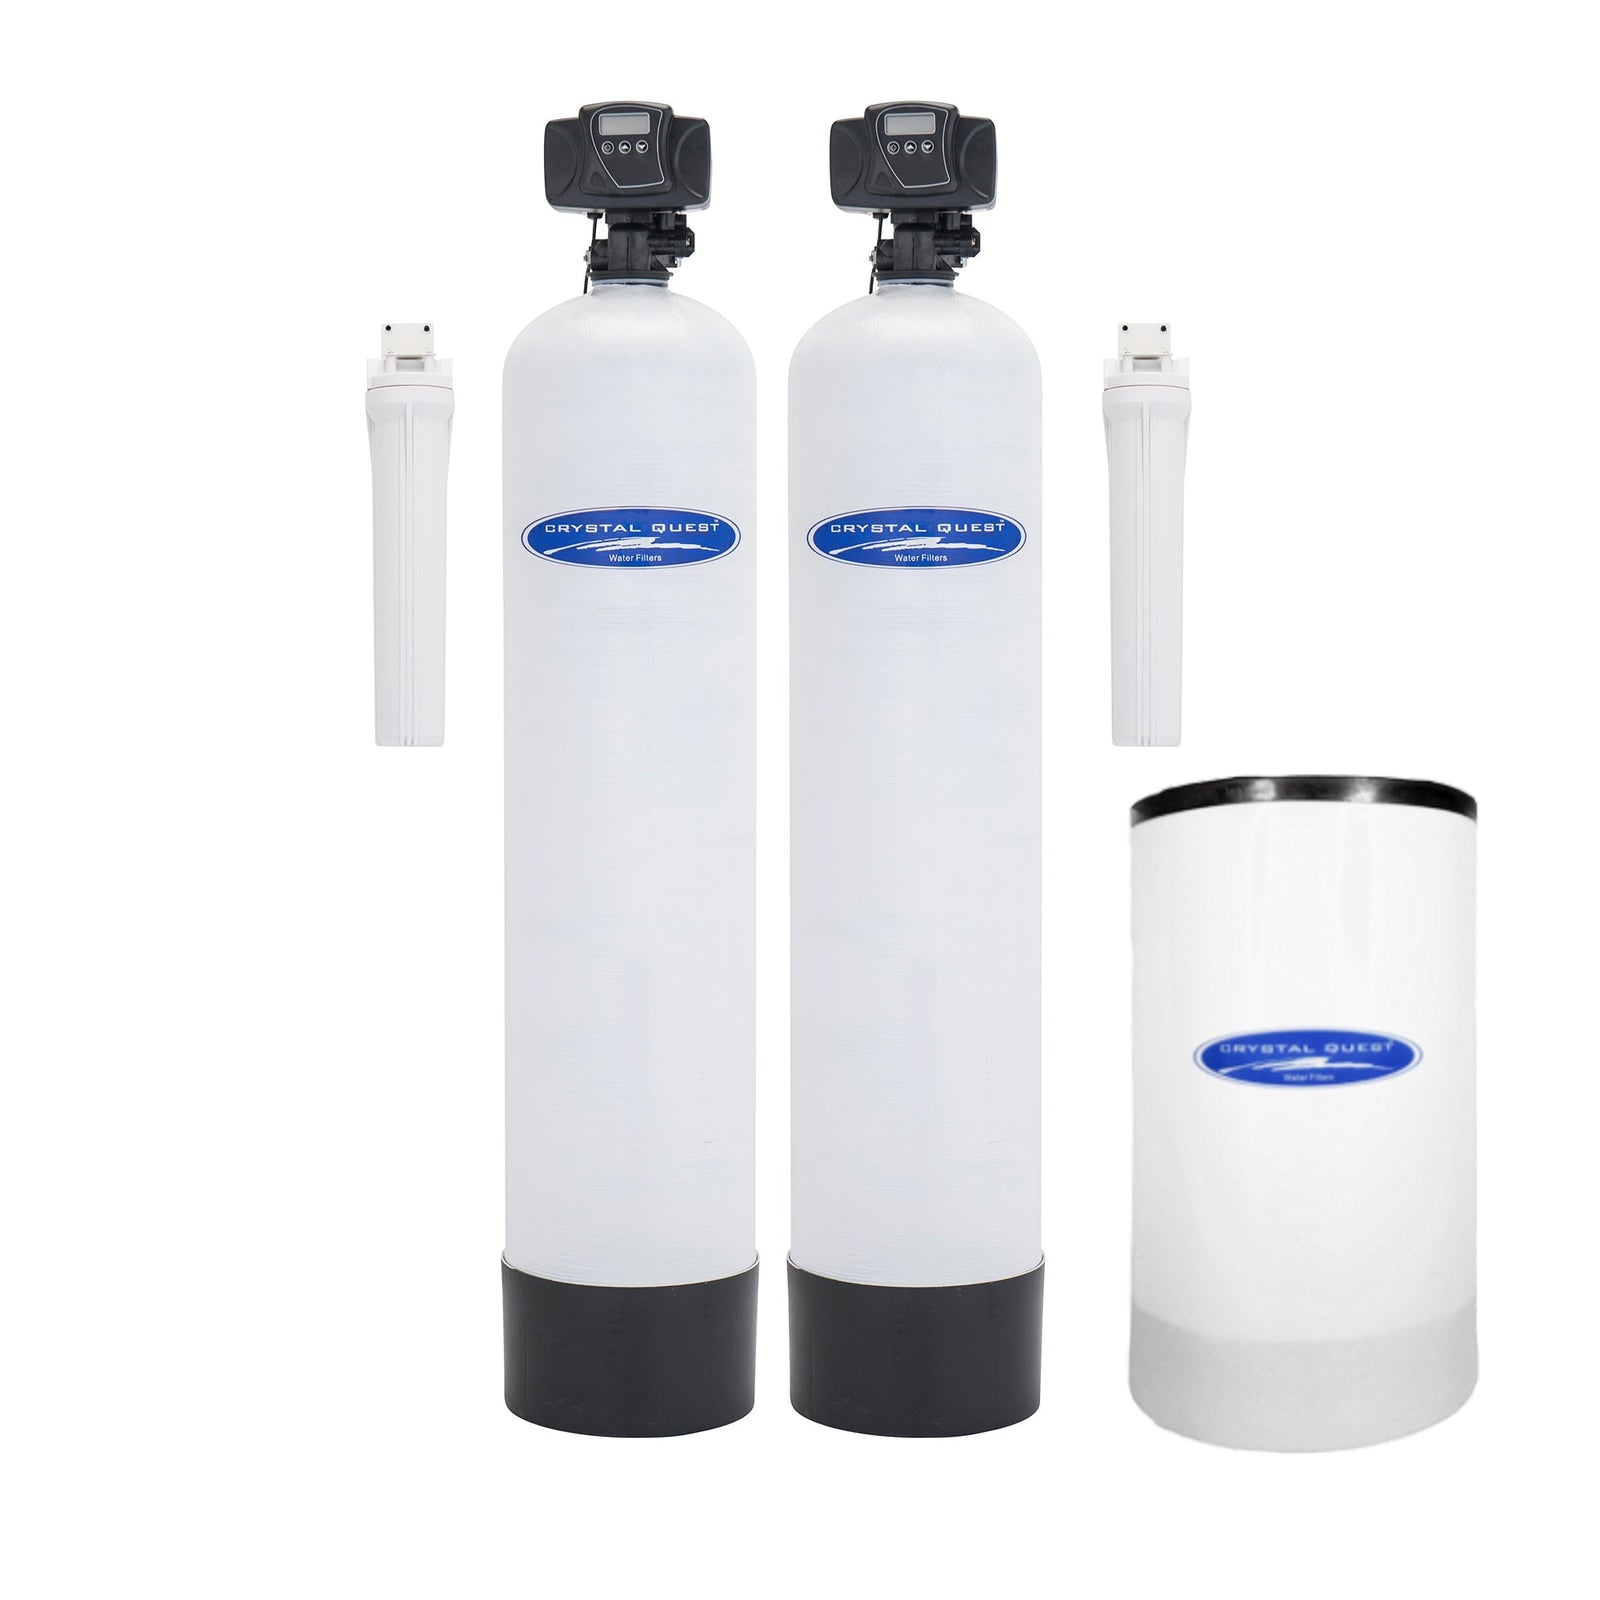
Filter + softener
You want filtration and have confirmed hardness to address. Check existing equipment before adding both.
Both units require maintenance, space and a suitable installation.
Proposed pricing. Installation, shipping and tax are additional. Purchases are paused during the pilot. You hire and pay your plumber directly.
For drinking water alone, a suitable kitchen-tap filter may be enough. Keep working equipment that already meets your goal. Wells, shared plumbing and unusually high demand need a separate assessment. No Clearhouse system is claimed to remove every substance in this report. [5]
Choose equipment using model-specific performance evidence and maintain it as instructed. Removing disinfectant throughout a home also changes microbial protection in the plumbing. [5]
Your water report is the start. Your home decides the fit.
Tell us your supplier, your water goals and how your home uses water. If the evidence is missing, the next step is a test or a review.
- Confirm the name on your water bill.
- Share bathrooms, household size and existing equipment.
- Choose a system. Hire your own plumber.
Want help choosing?
Send your water goals to Clearhouse for a fit review.
Manatee County water questions, answered.
Is Manatee County tap water safe to drink?
The listed compliance tables in Manatee County Utilities’ 2025 report show no MCL, disinfectant-limit, treatment-technique or lead/copper action-level violations. That annual report does not establish the condition of an individual home’s plumbing or replace a current utility advisory. Check your supplier’s latest notices if conditions change. [1] [9]
How hard is Manatee County water?
Manatee County Utilities reported 106–279 mg/L as calcium carbonate in 2025, equal to approximately 6.2–16.3 grains per gallon. That spans moderately hard through very hard on the USGS scale. Test untreated water at your home before selecting and setting up a softener. [2] [4]
Were PFAS found in Manatee County Utilities water?
The utility’s UCMR5 notice says all results for 29 PFAS and lithium sampled in 2024 were below EPA minimum reporting levels. Below a reporting level is not the same as zero. These are 2024 monitoring results, not a current household PFAS test. [3]
Does Manatee County use chlorine or chloramine?
The 2025 Manatee County Utilities report lists chloramines. If reducing disinfectant taste or odor is your goal, confirm that the specific filter is designed and tested for chloramine reduction at your home’s required flow rate. A chlorine-only claim is not proof of chloramine performance. [1] [5]
Is the City of Bradenton water report the same?
No. The City of Bradenton publishes its own water quality report. A Bradenton mailing address does not establish which utility serves the property. Read the supplier name on the water bill before applying this page’s Manatee County Utilities results. [7]
Will a water softener remove everything in this report?
No. A conventional softener targets hardness minerals. A filter and a softener do different jobs, and neither product category guarantees removal of every listed substance. Match any contaminant-reduction claim to the exact system and its certification or performance documentation. [5] [6]
Do I need a whole-house system if I only want better drinking water?
Possibly not. If the goal is limited to drinking and cooking water, a suitable filter at the kitchen tap may meet that goal. A whole-house system is worth considering when you want treatment at multiple fixtures and can maintain the equipment. [5]
Who installs a Clearhouse system?
You choose, hire and pay your plumber directly. Clearhouse supplies the equipment. Your plumber confirms pipe size, water pressure, peak flow, available space, drainage and the installation quote before work begins.
Sources & how this report was built
Clearhouse transcribed the utility’s published results, preserved the measurement type and year, and converted hardness using the utility’s stated divisor. The report distinguishes compliance limits, action levels, health goals, secondary standards and tests below reporting levels.
This is a selected, organized reading of the documents—not independent laboratory testing. Source documents control if a discrepancy is found. Updates are reviewed manually; the date above is a source-check date, not a new sampling date.
Clearhouse sells water treatment equipment. Product links are commercial; source data come from the organizations listed here. Clearhouse is not affiliated with the utility.
- Manatee County Utilities · 2025 Water Quality Report
- Manatee County Utilities · Additional Water Quality Information (2025)
- Manatee County Utilities · UCMR5 notice, 2024 sampling
- USGS · Hardness of Water
- CDC · Choosing Home Water Filters
- CDC · Home Water Treatment Systems
- City of Bradenton · 2025 Water Quality Report
- City of Palmetto · Potable Water
- Manatee County · Water Division and current notices
- MyTapWater · Manatee County Utilities · FL6411132 · Source reviewed October 3, 2026